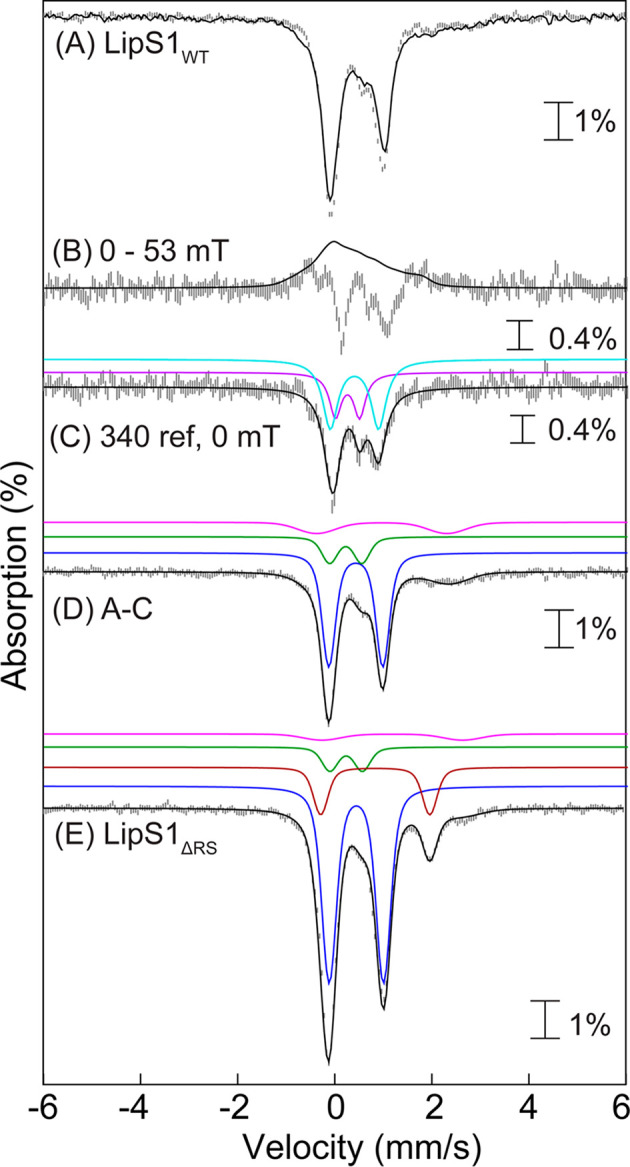
Figure 4.

(A) Mössbauer spectra of reconstituted LipS1WT collected at 4.2 K with an external applied magnetic field of either 0 mT (vertical bars) or 53 mT oriented parallel to the γ beam (solid line). (B) [0–53 mT] difference spectrum (vertical bars) and simulation of the LipS1WT [Fe3S4]0 cluster in 53 mT using previously reported parameters12 (black line). (C) Zero-field reference spectrum of the LipS1WT [Fe3S4]0 cluster (vertical bars). Black line is the simulation of the LipS1WT [Fe3S4]0 cluster in zero field with parameters from Table S6. Individual contributions from the exchange coupled Fe22.5 (cyan line) and FeIII (purple line) sites with a 2:1 intensity ratio. (D) 0 mT – 30% zero-field reference spectrum of the LipS1WT [Fe3S4]0 cluster (vertical bars) showing the presence of three quadrupole doublets corresponding to [Fe4S4]2+ (47% of total intensity, blue line), [Fe2S2]2+ (12% of total intensity, green line) clusters, and N/O-coordinated high-spin FeII (11% of total intensity, pink line). The black line represents the overall simulated spectrum. (E) Mössbauer spectra of reconstituted LipS1ΔRS collected at 4.2 K in absence of any externally applied magnetic field. The black line represents the overall simulated spectrum. The blue and brown lines are individual contributions from the [Fe4S4]2+ cluster (69% of the total intensity) and the unique Fe site of a [Fe4S4]2+ cluster coordinated by 2–3 N/O ligands (17% of the total intensity), respectively. The green and pink lines show the contributions from [Fe2S2]2+ clusters (9% of total intensity) and N/O-coordinated high-spin FeII (5% of total intensity), respectively.
