. 2022 Oct 3;14(40):15141–15155. doi: 10.1039/d2nr03792k

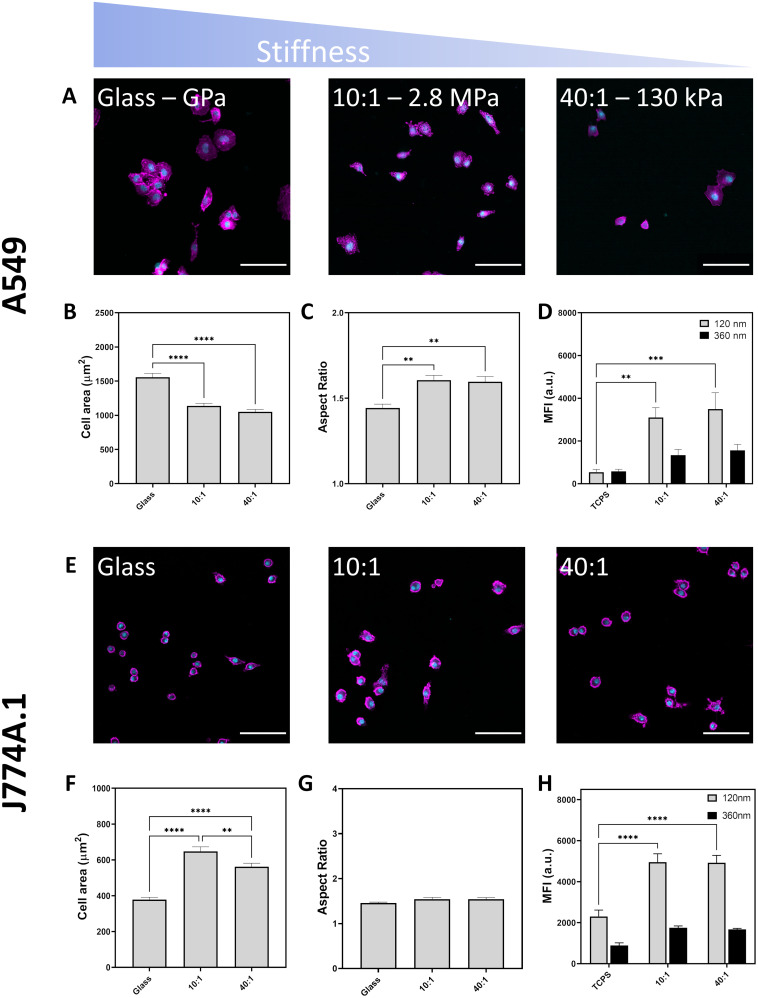
Fig. 2. Effect of substrate stiffness on cell morphology imaged by confocal laser scanning microscopy. Nuclei labelled in cyan and F-actin labelled in magenta. Scale bars represent 100 μm. (A) A549 attachment to glass, PDMS 10 : 1 and PDMS 40 : 1 following 24 hours of culture. (B) Cell area of A549 cultured on different substrates. (C) Aspect ratio of A549 cultured on mechanically distinct substrates. (D) Median fluorescence intensity of A549 cells upon exposure to fluorescent silica particles (120 nm and 360 nm) at a concentration of 20 μg mL−1 for six hours (E) light microscope images of J774A.1 cells showing their attachment and spreading on various surfaces. (F) Quantification of J774A.1 cell area on different substrates, (G) quantification of J774A.1 aspect ratio on different substrates. (H) Median fluorescent intensity of J774A.1 reflecting particle uptake via flow cytometry. All experiments performed with three biological replicates. Statistical significance determined by one-way ANOVA with Tukey's test, *p < 0.05, **p < 0.01, ***p < 0.001, ****p < 0.0001.

Fig. 2