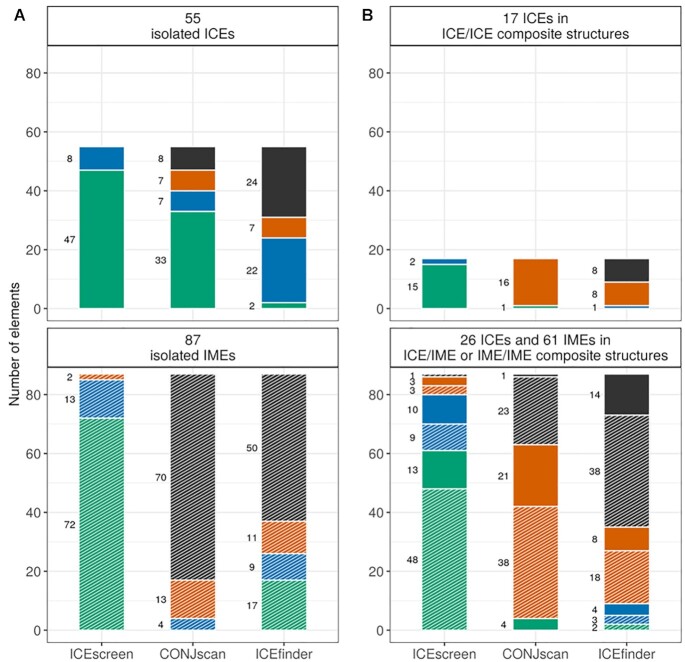
Figure 3.
Number of elements reported by ICEscreen, CONJscan and ICEfinder compared to the ICEs and IMEs of the FirmiData reference. Elements of FirmiData that were detected by a tool and share exactly the same SP composition (all SPs detected and co-localized without additional SPs) and a similar element type as the reference are represented in green. Wrongly characterized elements sharing strictly the same SPs are represented in blue. Elements of FirmiData that have been detected by a tool but for which SPs are missing and/or wrongly added are also represented in blue. Elements of the reference that were detected by a tool but combined with other elements are represented in orange. Elements of the reference that were not detected by a tool are represented in black. The top A panel and the bottom A panel refer to isolated ICEs and IMEs, respectively. The panels on the right show the number of elements in composite structures (only composed of ICEs: top B panel; composed of ICEs & IMEs or IMEs only: bottom B panel). The number of ICEs and IMEs are represented in solid color and in hashed color, respectively.

