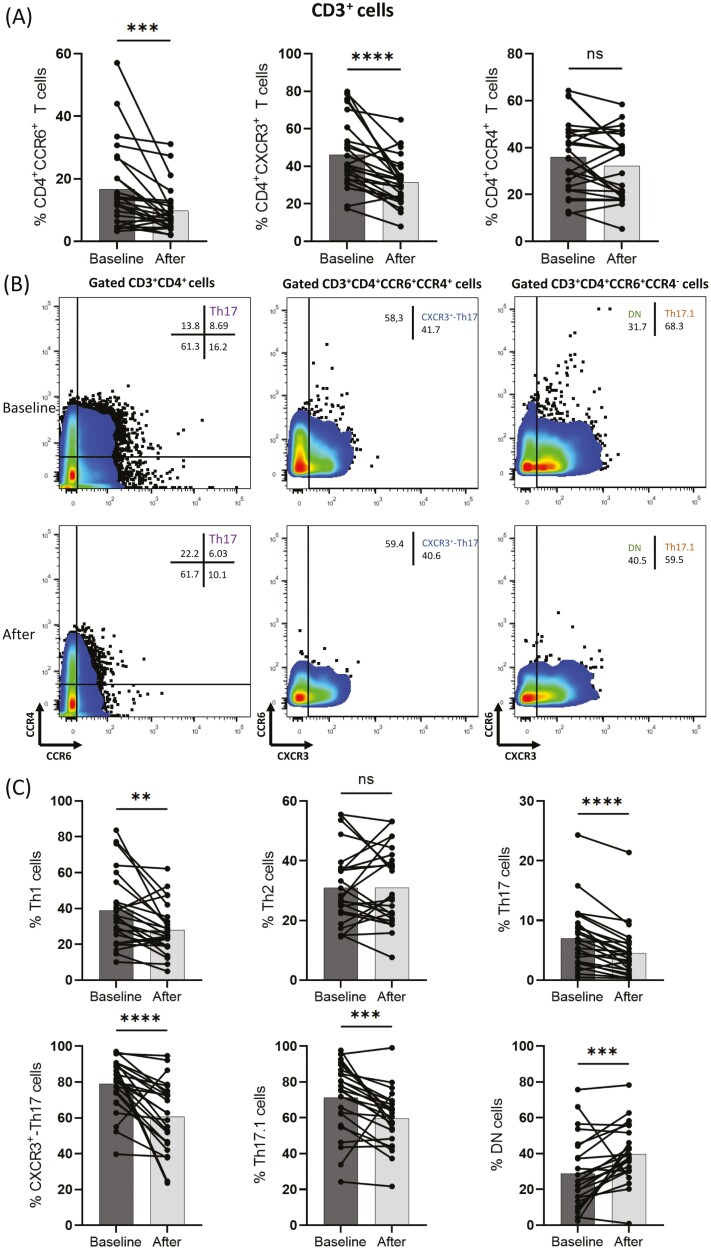
Figure 2:
Analysis based on flow cytometry plots from peripheral blood mononuclear cells (PBMCs) from responding to therapy psoriasis patients (n = 25) was performed. Individual cell subsets were sub-gated based on the expression of CD3, CD4, CCR6, CCR4, and CXCR3 surface markers. (A) Changes in frequency of CD3+CD4+CCR6+T cells, CD3+CD4+CXCR3+T cells, and CD3+CD4+CCR4+T cells in peripheral blood at baseline and after anti-IL-17 biologic therapy. The percentage out of CD4 population is displayed. (B) Representative flow cytometric plots showing changes in T-cell phenotypes in a psoriasis patient at baseline and after anti-IL17 biologic therapy. (C) Box graphical representation showing a significant decrease in Th1, Th17, CXCR3+-Th17, and Th17.1 cell subsets after anti-IL17 biologic therapy and an increase in DN cells in peripheral blood from psoriasis patients. Percentages out of origin population from which each population is further sub-gated, as described in Fig. 1. Bar graphs showing the mean ± SD. ns P > 0.05, **P ≤ 0.01, ***P ≤ 0.001, ****P ≤ 0.0001 by Wilcoxon signed rank test or paired t-test.

