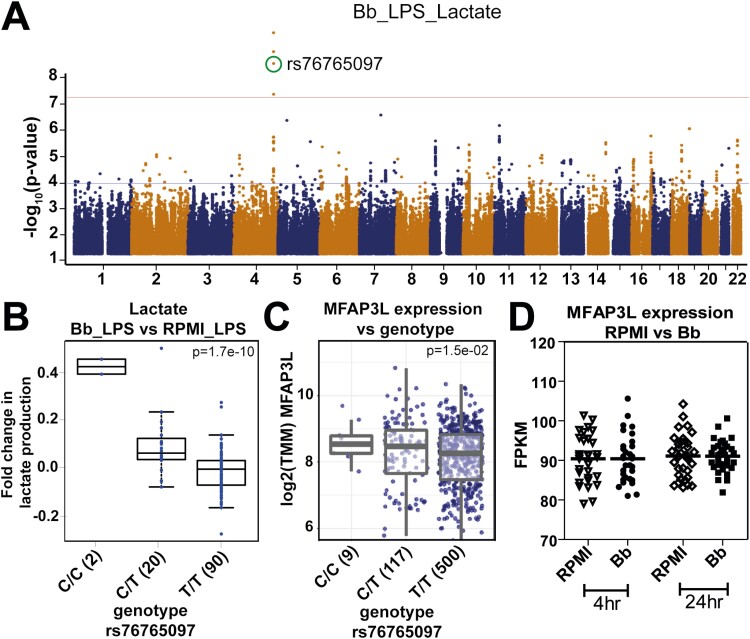
Figure 2:
GWAS analysis indicates MFAP3L to be involved in lactate production in B. burgdorferi-exposed cells. (A) Manhattan plot of genome-wide QTL mapping of LPS-induced fold-changes in lactate production in primary monocytes previously exposed to B. burgdorferi (Bb). The upper horizontal line (red colour) represents the threshold for genome-wide significance (p<5x10⁻⁸). (B) LPS-induced fold change in lactate production in B. burgdorferi-exposed PBMCs obtained from individuals with different genotypes of SNP rs76765097. (C) Gene expression levels of MFAP3L, normalized by TMM method (Trimmed Mean of M values) in whole blood from healthy volunteers with different genotypes of rs76765097. P-values were calculated using a linear model with age and sex as covariates. (D) Relative gene expression of MFAP3L in PBMCs from healthy volunteers (n = 30) stimulated for 4 and 24 hour with B. burgdorferi. Data were extracted from a publicly available dataset through the NCBI Gene Expression Omnibus database, accession code GSE42606. Data are represented as median of fragments per kilobase of transcript per million mapped reads (FPKM).

