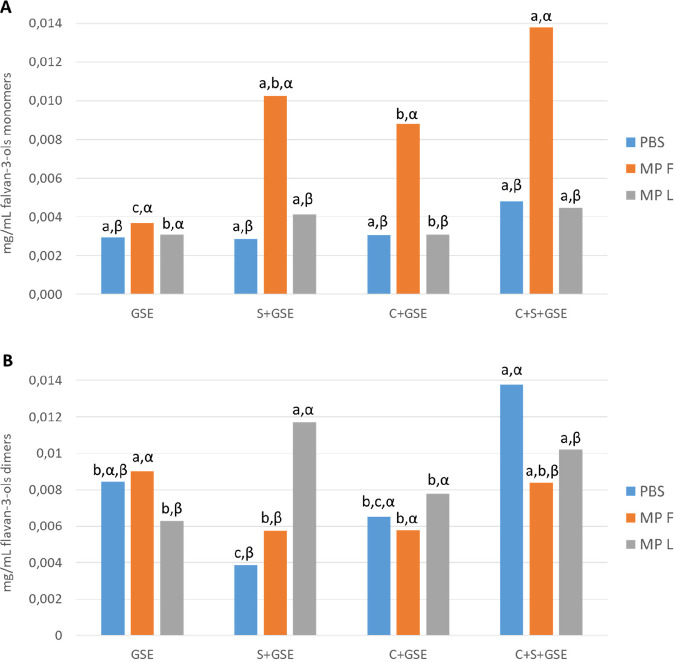
Figure 4.
Content of flavan-3-ol monomers (A) and dimers (B) (mg/mL) obtained by HPLC-DAD-MS quantification after the interaction assays, evaluating the effect of the mannoproteins F and L on the different systems: control condition without cells, oral cells with flavan-3-ols (GSE), salivary proteins with flavan-3-ols (S+GSE), oral cells with flavan-3-ols (C+GSE), and oral cells with salivary proteins and flavan-3-ols (C+S+GSE). Different Roman letters indicate statistical differences (p < 0.05) among samples in the four systems (GSE, S+GSE, C+GSE, and C+S+GSE) while different Greek letters indicate statistical differences (p < 0.05) among samples in the different treatments (PBS, MPF, and MPL).

