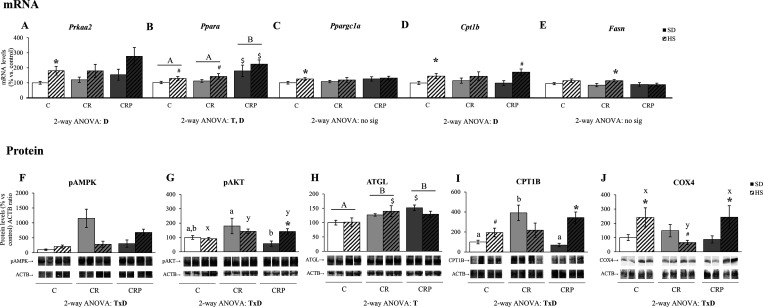
Figure 3.
Heart mRNA and protein levels of genes related to lipid oxidation and the control at 6 months of age. (A–E) mRNA levels of the genes Prkaa2 (coding for the AMP-activated protein kinase (AMPK) α subunit), Ppara (for peroxisome proliferator-activated receptor (PPAR) α), Ppargc1a (for PPARγ co-activator 1 α), Cpt1b (for carnitine palmitoyltransferase 1b (CPT1B)), and Fasn (for fatty acid synthase). (F–J) Protein levels of phosphorylated AMPK, phosphorylated AKT, adipose triglyceride lipase (ATGL), CPT1B, and cytochrome c oxidase subunit 4 (COX4). Below the (F)–(J) graphs, representative Western blot images of the corresponding bands are shown: pAMPK 63 kDa, pAKT 60–62 kDa, ATGL 54 kDa, CPT1B 75–85 kDa, COX4 19 kDa, and ACTB 42 kDa. Results are expressed as a percentage of the mean value of the control group, mean ± SEM of 6 to 10 animals per group. C, offspring of control dams; CR, offspring of dams subjected to calorie restriction during the first 12 days of pregnancy; CRP, CR rats supplemented with high-esterified pectin between days 21 and 180. SD, standard diet; HS, high-sucrose diet (supplemented between days 135 and 180 of life). Statistics: ANOVA and post-hoc as explained in Figure 1 legend, A ≠ B, a ≠ b, x ≠ y. Mann–Whitney U test (p < 0.05): *HS versus SD, $CR or CRP group versus C group (same diet), #HS versus SD at the p < 0.1 level. n.s., non-significant.

