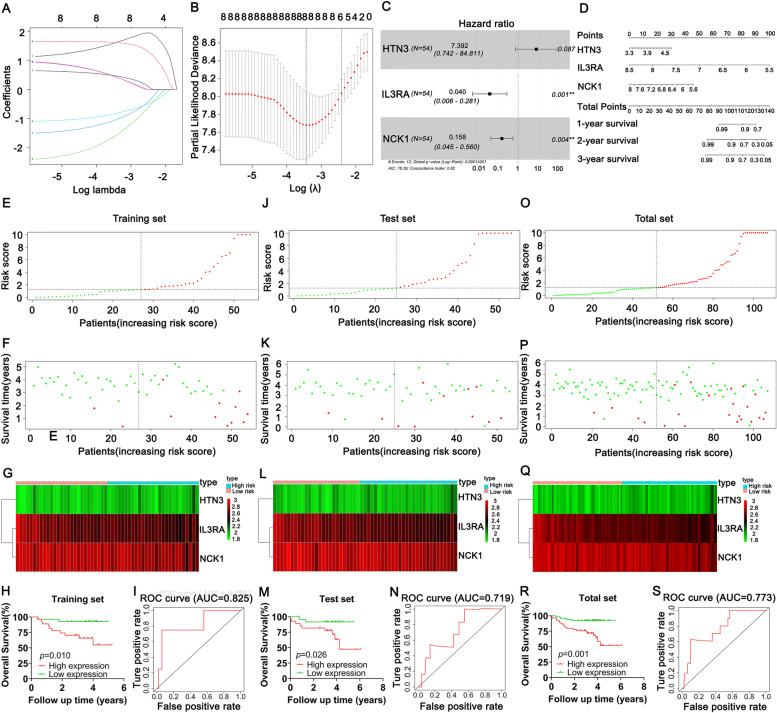
Fig. 2.
Construction and validation of the novel risk score model. A-B The relative regression coefficients of 8 genes identified by the LASSO regression analysis. C Multivariate Cox analysis of 3 DEGs. D Nomogram of 3 DEGs. E-I The distribution of the risk score, survival status, expression of 3 survival-related DEGs in high-risk and low-risk groups, Kaplan–Meier survival curve, ROC curve analyses of the risk score model in the training set. J-N The distribution of the risk score, survival status, expression of 3 survival-related DEGs in high-risk and low-risk groups, Kaplan–Meier survival curve, ROC curve analyses of the risk score model in the test set. O-S The distribution of the risk score, survival status, expression of 3 survival-related DEGs in high-risk and low-risk groups, Kaplan–Meier survival curve, ROC curve analyses of the risk score model in the total set

