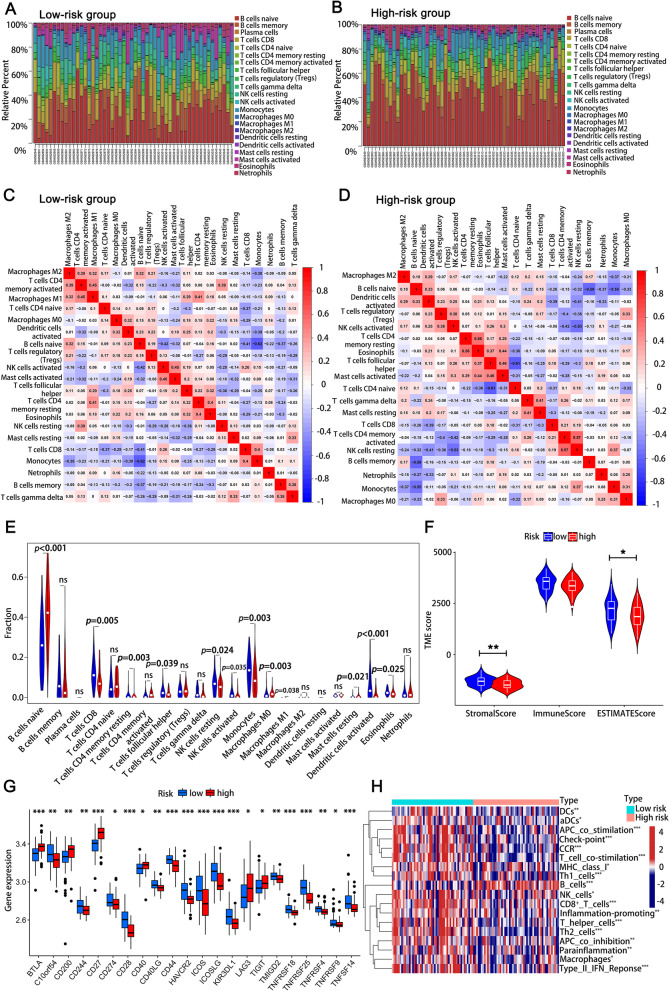
Fig. 3.
Immune signatures of low- and high-risk groups of CLL patients. A The infiltration of 22 types of immune cells in the low-risk group. B The infiltration of 22 types of immune cells in the high-risk group. C Correlations between immune cells in low-risk group. D Correlations between immune cells in high-risk group. E Differential expression of immune cells in low- and high-risk groups. F The stromal score, immune score and ESTIMATE score in high-risk group were lower than those in low-risk group. G Differential expression of immune checkpoint in low- and high-risk groups. H The heatmap of immune function analysis in low- and high-risk groups. (*p < 0.05, **p < 0.01, ***p < 0.001)

