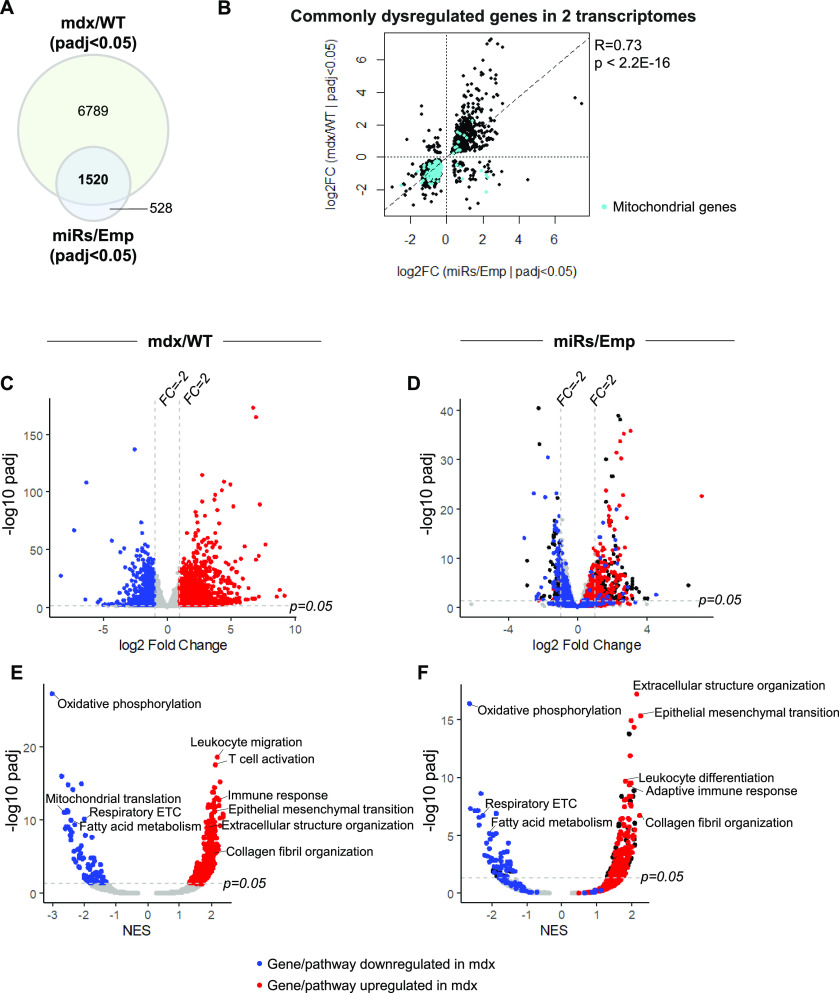
Figure 3. Comparison of the transcriptomic profiles between 14 DD-miRNAs ectopic expression and the mdx dystrophic muscle.
(A) Venn diagram of dysregulated genes in mdx diaphragm compared with wild-type control and in DD-miRNA-overexpressed TA muscle compared with AAV control. (B) Dot plot of log2 fold change values of 1,520 commonly dysregulated genes in the two transcriptomes and its Pearson correlation test. Cyan dots represent mitochondrial-related genes (Mitocarta 2.0). (C, D) Volcano plots of mdx/WT transcriptome (C) and miRs/Emp transcriptome (D). Blue and red dots are of, respectively, down- and up-regulated (FCmdx/WT > 2, adjusted P-value < 0.05) genes in C (mdx versus WT) The same genes and their coloration is projected on the graph in D, of (miRs/Emp). (E, F) Volcano plots of all Hallmark and Gene Ontology (Biological Processes) gene sets from GSEA analysis, comparison of mdx/WT transcriptome (E) and miRs/Emp transcriptome (F). Blue and red dots are of, respectively, down- and up-regulated (adjusted P-value < 0.05) Biological Processes in (E) (mdx versus WT). The same Biological Processes and their coloration are projected on the graph in (F), of (miRs/Emp). This visualization demonstrates high-level similarity of up and down-regulation of genes and biological processes between the two systems.

