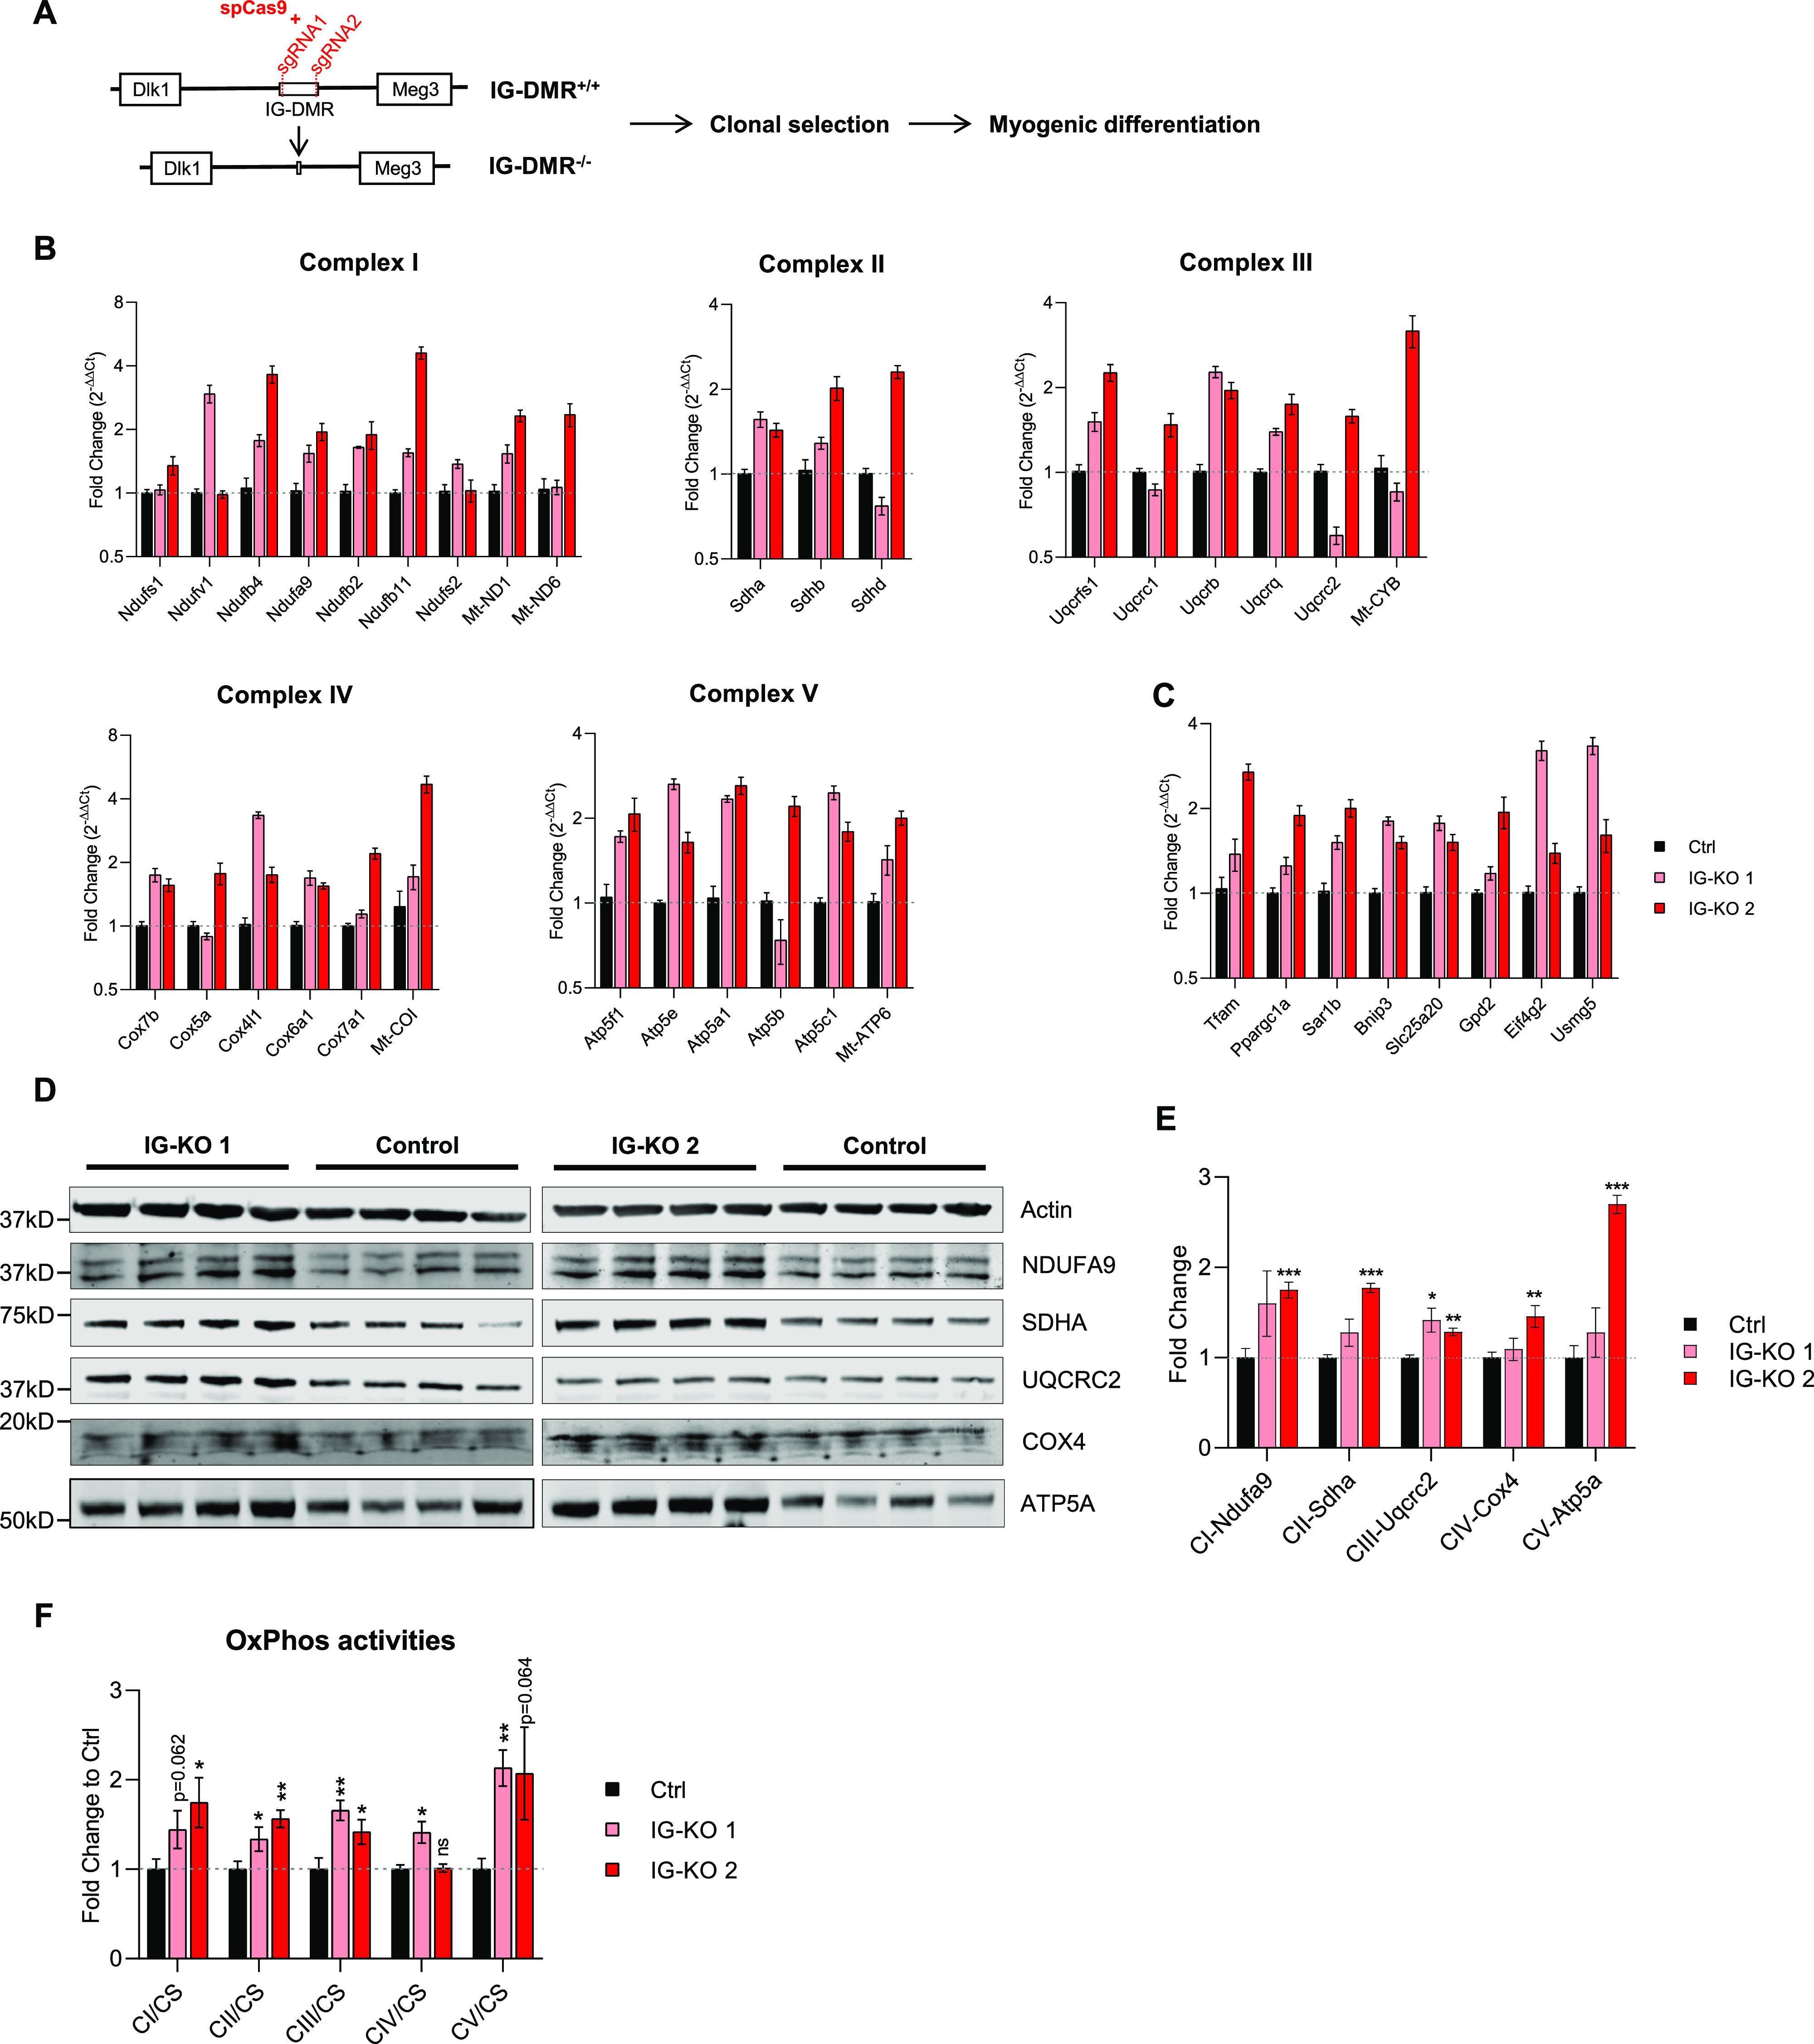
Figure 6. Knocking down DD-miRNAs results in increased OxPhos expression and activity.

(A) Diagram of IG-DMR deletion by CRISPR-Cas9. (B, C, D, E, F) Analysis of DD-miRNAs knocked-down iPS clones compared with control (2 iPS clones, n = 4). (B), RNA level of selected transcripts of five OxPhos complexes and (C), predicted DD-miRNA targets; (D), Western blot of five representative proteins for five OxPhos complexes, and (E), its quantification. (F), CS-normalized activity of five OxPhos complexes. Data presented as mean ± SEM. Statistics were performed with t test. *P < 0.05; **P < 0.01; ***P < 0.001.
