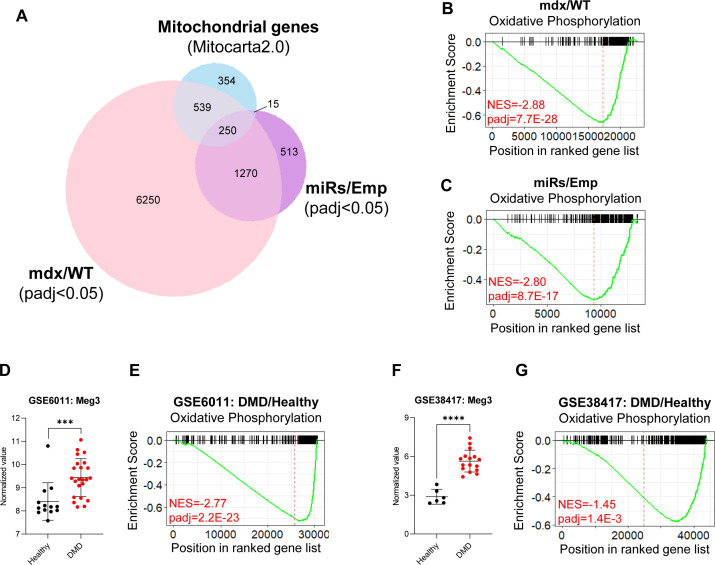
Figure S3. DD-miRNAs affect mitochondrial functions in the dystrophic muscle.
(A) Venn diagram of mitochondria-related genes (Mitocarta 2.0) and of significantly dysregulated genes, in mdx/WT and miRs/Emp transcriptomes. (B, C) GSEA analysis of OxPhos gene set comparing mdx versus WT diaphragms (A) and miRs versus Emp TA muscles (B). (D, E, F, G) Expression level of Meg3 transcript and GSEA analysis of OxPhos gene set in muscle biopsies of Duchenne muscular dystrophy patients compared with healthy controls in two different datasets. Data were taken and reanalyzed from GEO GSE6011 (Pescatori et al, 2007) (D, E) and GEO GSE38417 (F, G). Data are presented as mean ± SD. *P < 0.05; **P < 0.01; ***P < 0.001.

