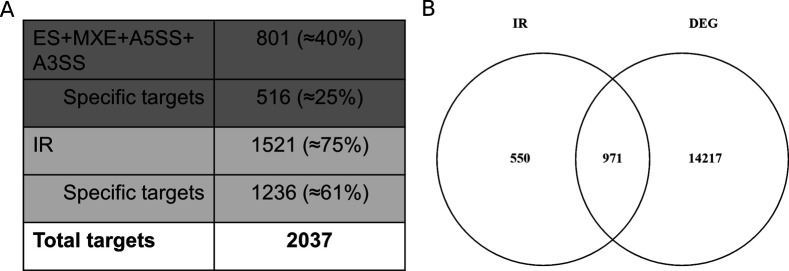
Figure S3. Quantification and percentual distribution of targets showing alternative splicing.
(A) Number and percentage of AS events identified in mdf-1 in respect to WT. Specific targets are defined as targets that showed one form of AS but do not contain other forms of AS. (ES, exon skipping; MXE, mutually exclusive exon; A5′SS, alternative 5′ splice site; A3′SS, alternative 3′ splice site; IR, intron retention). (B) Venn diagram showing the overlap between differentially expressed genes and genes that show increased intron retention in mdf-1 as compared with WT.

