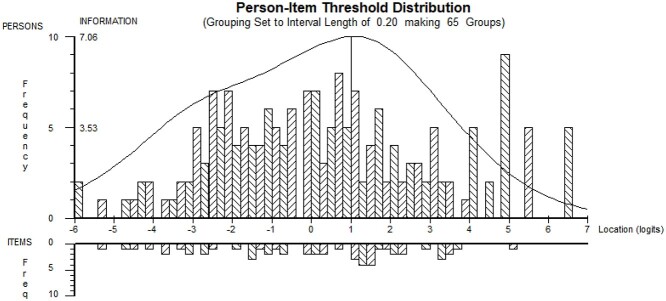
Figure 1.
North Star Assessment for limb-girdle type muscular dystrophies (NSAD) person-item threshold distribution plot demonstrating good coverage of items for the population. The top histogram illustrates the abilities of the population, from the weakest on the left to the strongest on the right. The bottom histogram demonstrates a well-distributed range of items that test the ability of the population, with a ceiling for the individuals who were the very strongest and asymptomatic.

