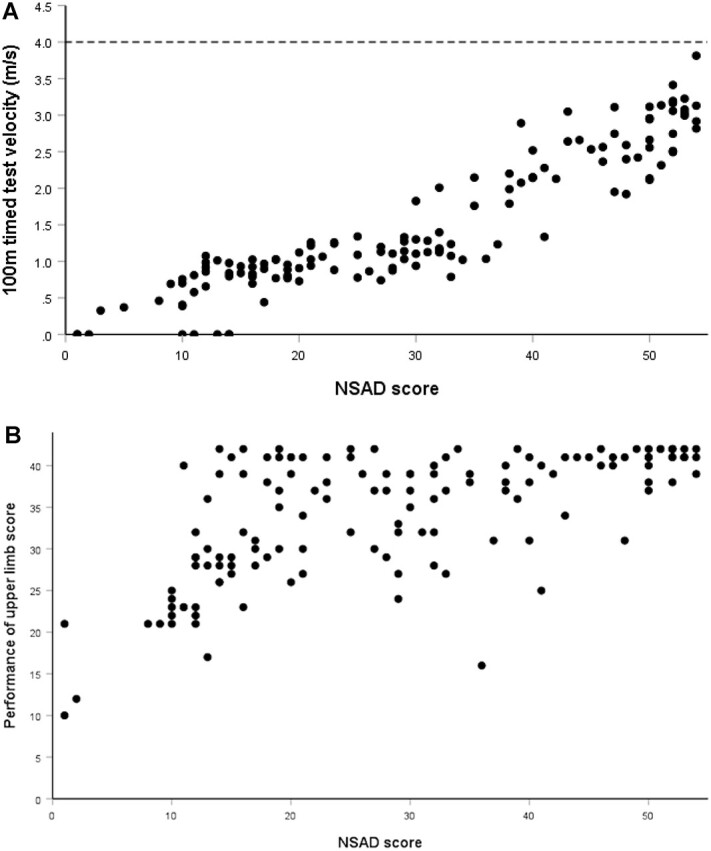
Figure 3.

Test correlations. (A) North Star Assessment for limb-girdle type muscular dystrophies (NSAD) total score and 100-m timed test velocity (m/s) scatterplot. There was a strong correlation between motor performance, as measured with the NSAD total score, and run/walk velocity. The line at 4 m/s indicates normal 100-m velocity for children 8 to 14 years old. (B) NSAD total score and Performance of Upper Limb 2.0 assessment score scatterplot. Despite excellent gross motor performance, as indicated by high NSAD scores, some individuals who were ambulatory experienced significant upper limb dysfunction.
