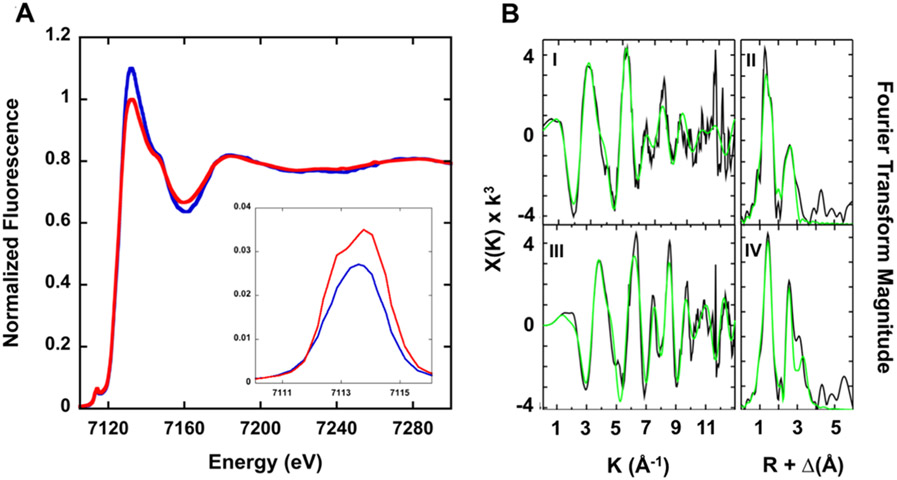
Figure 7.
(A) Iron XANES for brand (blue) and generic (red) SFG products. (Inset) An expansion of the 1s–3d pre-edge transition peak for both brand (blue) and generic (red) SFG products. (B) Iron EXAFS and Fourier transform of EXAFS data for brand (I and II) and generic (III and IV) SFG products. (Left) Raw EXAFS data displayed in black and best fit in green. (Right) Corresponding Fourier transform plot of raw EXAFS data in black and best fit in green.

