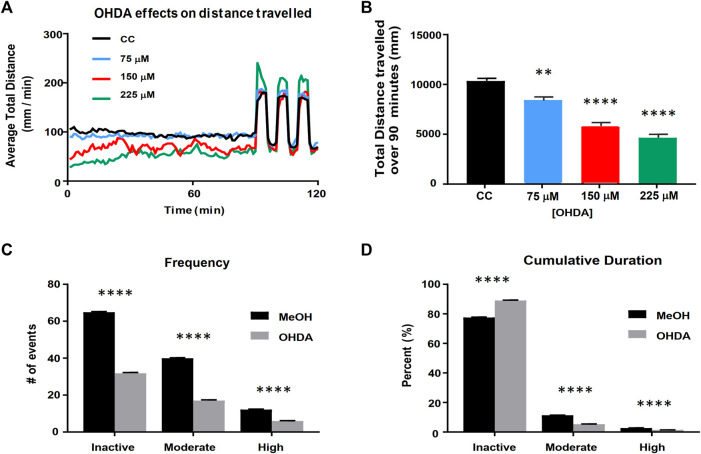
FIGURE 3.
Validation of the larval zebrafish OHDA model. Panel (A) Behavioral profiles of total distance traveled (60 s bins) following OHDA exposure from 48 to 120 hpf. Panel (B) Total distance travelled during the first 90 min in the light following OHDA exposure from 48 to 120 hpf (n = 36). Advanced activity analytics (C,D) of Total Frequency of switching between activity states (C) and the nested Cumulative Duration in each activity state (D) (n = 48). CC vs. OHDA, ** = p < 0.01 **** = p < 0.0001.

