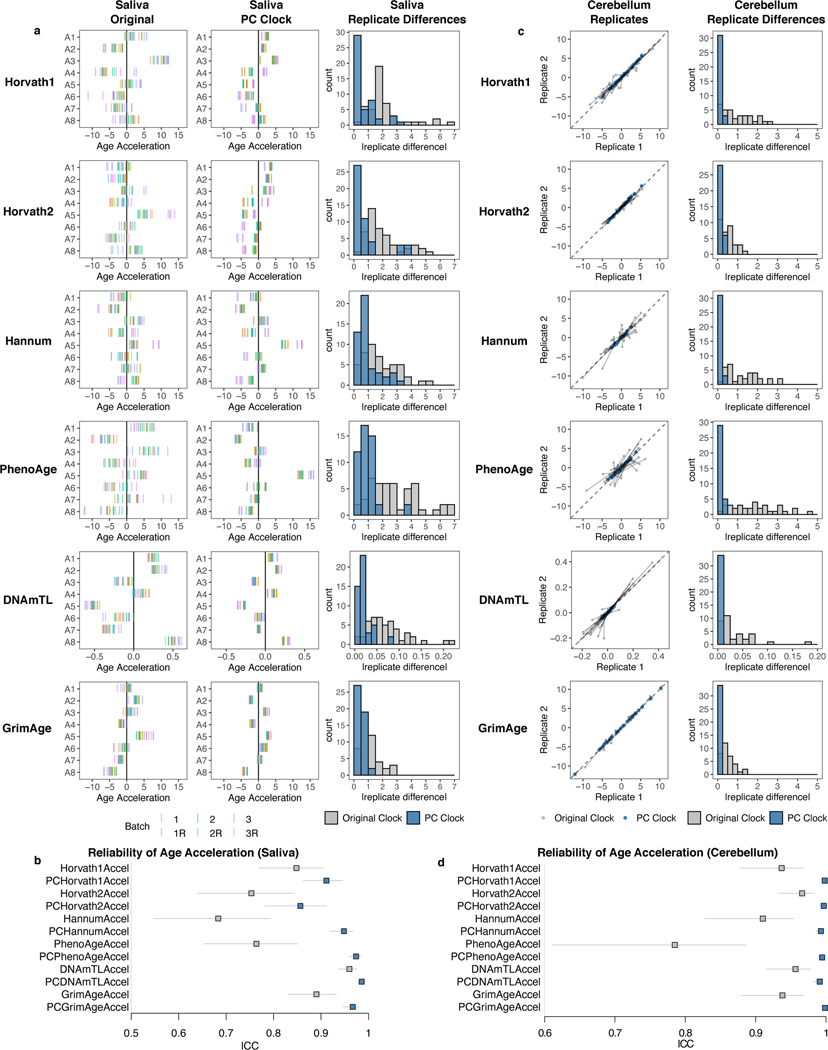
Fig. 5. PC clocks are reliable in saliva and brain.
a, The original clocks and corresponding PC clocks were calculated for 8 saliva samples with 18 technical replicates each (3 batches, 3 replicates per batch, 2 scans per batch). Note that we did not plot standard deviation of epigenetic age acceleration because there were insufficient samples to reliably calculate this value, and we found that much of the variation in the original clocks stemmed primarily from noise. b, Clock ICC values derived for 8 saliva samples with 18 technical replicates each, treating each batch and scan separately. Data are presented as ICC estimate with 95% confidence interval. c, Agreement between technical replicates in cerebellum test data (GSE43414). Because of a systematic shift in epigenetic age between replicates, mean-centered epigenetic age values were used for both the original clocks and PC clocks. Grey indicates the original clock while blue indicates the PC clock. In scatterplots, grey lines connect the same pair of samples as measured by the original clock and the corresponding PC clock. d, Clock ICC values derived from 34 pairs of technical replicates in cerebellum. Data are presented as ICC estimate with 95% confidence interval.

