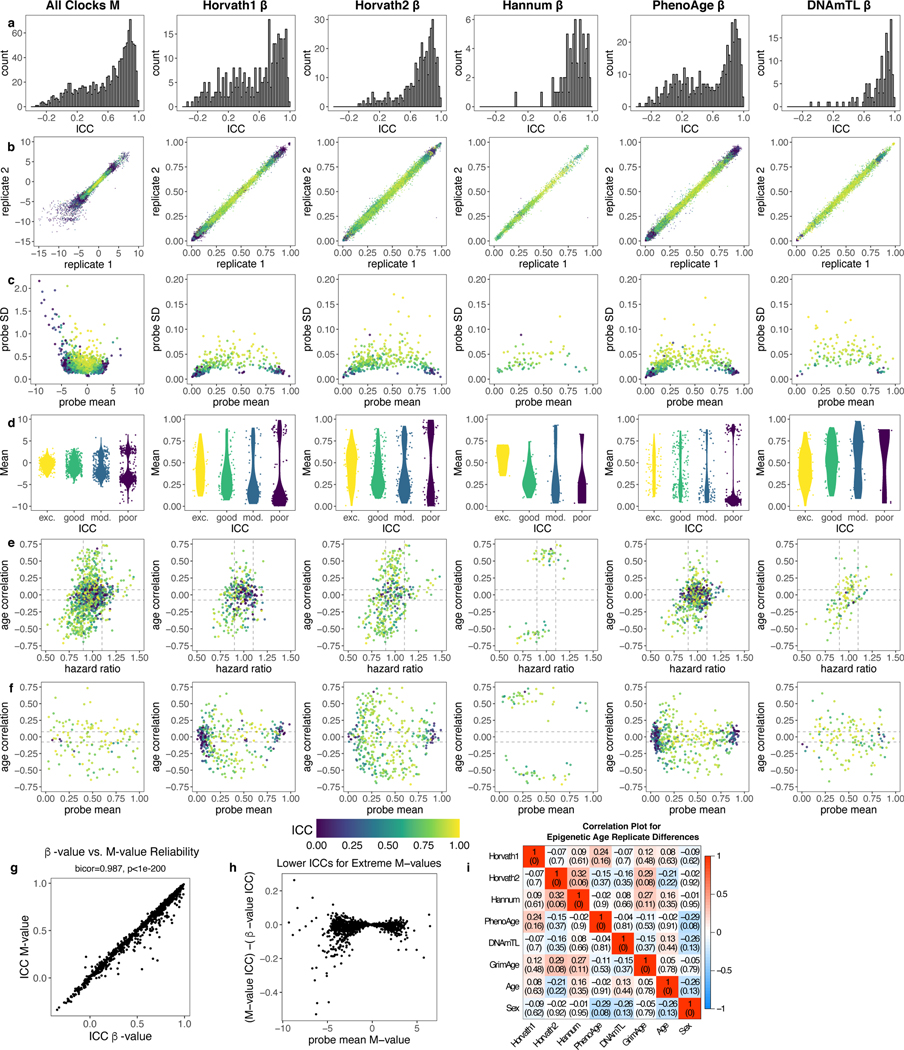
Extended Data Fig. 1. Additional reliability information about clock CpGs.
a-f, Reliability, age correlation, and mortality information for M-values from all clocks and β-values from individual clocks, similar to Fig. 1b-f. ICCs are quantified across 36 samples with 2 technical replicates each. Blood age correlations were calculated in GSE40279. Mortality associations (hazard ratios for 1 SD change in β or M value) were calculated in FHS (n = 3935 with 319 deaths). Shown are histograms of ICC of clock CpGs (a), agreement of technical replicates for CpG values where each point represents one pair of replicates for one CpG (b), and comparisons of ICC values to mean values, standard deviations, age correlations, and mortality associations where each point is one CpG (c-f). g-h, Comparison of M-value and β-value ICCs. Correlation test p-value is based on Student’s t distribution (two-tailed). i, Correlation plot for epigenetic age differences between replicates. Epigenetic age replicate differences were calculated for each clock separately, then the differences were correlated with each other and with age and sex. Data is reported as correlation (p-value). Correlation test p-value is based on Student’s t distribution (two-tailed).

