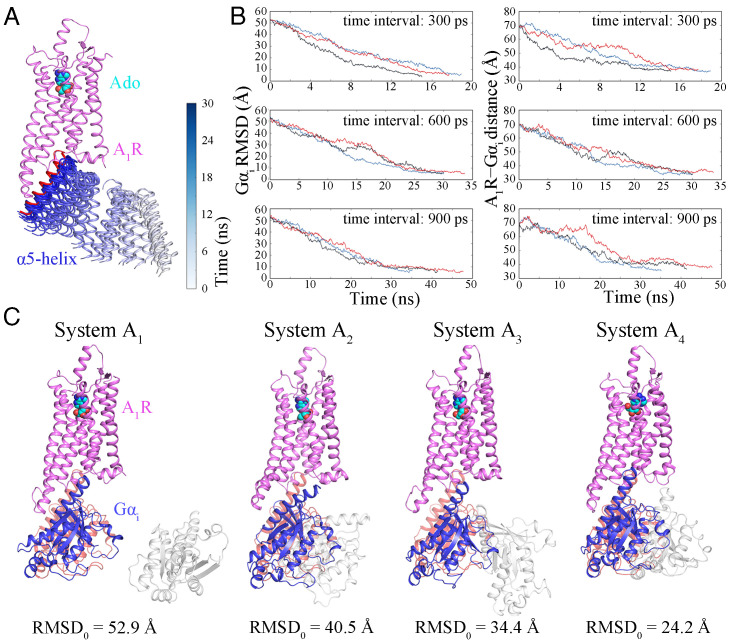
Fig. 1.
(A) Recognition of Gαi (only the α5-helix is shown) to the intracellular binding site of A1R. Trajectories of the α5-helix of Gαi (ribbons) are colored by simulation time on a silver (0 ns) to blue (30 ns) scale. The α5-helix of Gαi in the 6D9H structure is shown as a red ribbon. (B) Time-dependent Gαi rmsds and A1R–Gαi distances using time intervals of 300, 600, and 900 ps. (C) Binding of Gαi to A1R was observed in the trajectories of replicates with different initial positions and orientations of Gαi. A1R is colored violet, Gαi in the 6D9H structure is colored pink, the initial position of Gαi is shown in silver, and Gαi in the final snapshot is colored blue.

