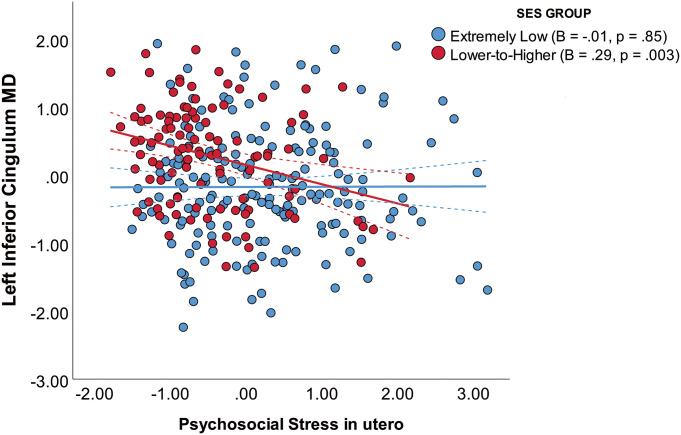
Fig. 2.
The interaction between psychosocial stress in utero and family socioeconomic status (SES) group on the left inferior cingulum bundle mean diffusivity (MD) at birth (n = 284). Here, MD values are shown as standardized residuals adjusted for infant PMA at scan. Solid lines represent the slope of each SES group, and dashed lines represent 95% CIs.

