Fig. 1.
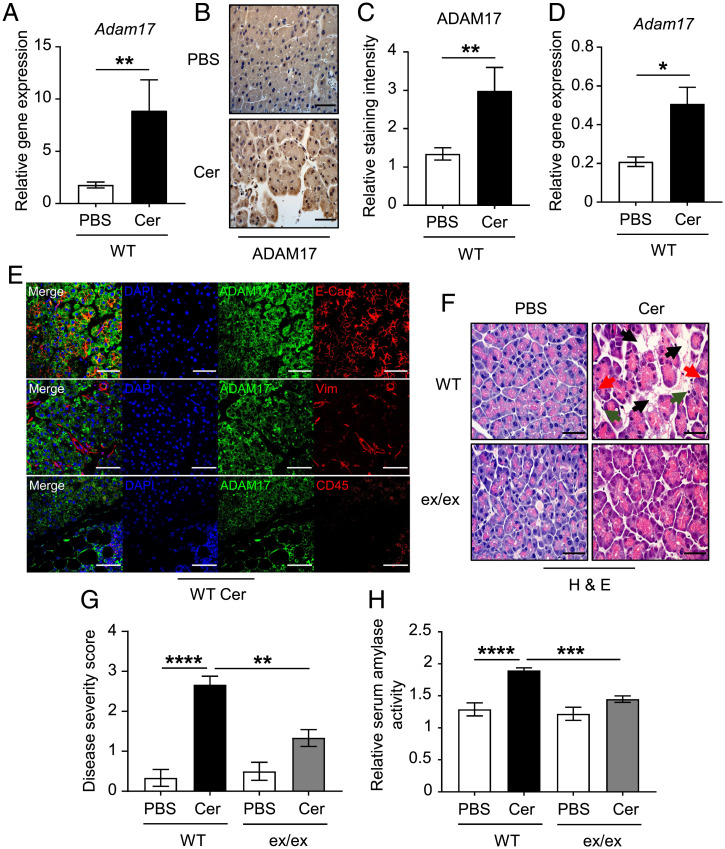
ADAM17 deficiency ameliorates cerulein-induced AP. (A) qPCR expression analysis of Adam17 gene (normalized against 18s rRNA) in pancreatic tissues from WT mice treated with either PBS (as a control) or cerulein (Cer) (n = 5 per group). **P < 0.01, Student’s t test. (B) Representative images of ADAM17-stained pancreatic sections from PBS or cerulein-treated WT mice. (Scale bar, 100 μm) (C) Quantification of ADAM17 staining intensity in pancreatic tissues of the indicated groups (n = 5 per group). **P < 0.01, Student’s t test. (D) qPCR expression analysis of the Adam17 gene (normalized against 18s rRNA) in pancreatic acinar cell cultures from WT mice treated with either PBS or cerulein (Cer) (n = 3 to 5 per group). *P < 0.05, Student’s t test. (E) Representative immunofluorescence images of pancreatic sections from cerulein-treated mice costained for ADAM17 and markers for epithelial cells (E-cadherin [E-Cad]), endothelial cells (Vimentin [Vim]), and total immune cells (CD45). DAPI nuclear staining is blue. (Scale bars, 100 μm) (F) Representative images of H&E-stained pancreatic sections from WT mice and Adam17ex/ex mice (ex/ex) treated with either PBS or cerulein (Cer). Black arrowheads point to edematous areas, green arrowheads point to immune cell infiltration, and red arrowheads point to necrotic cells. (Scale bars, 100 μm) (G) Histological disease severity scoring of pancreatic edema, necrosis, and inflammation in pancreatic tissues from the indicated groups (n = 6 to 8 per group). (H) Relative serum amylase activity in the indicated groups (n = 6 to 8 per group). **P < 0.01, ***P < 0.001, ****P < 0.0001, one-way ANOVA.

