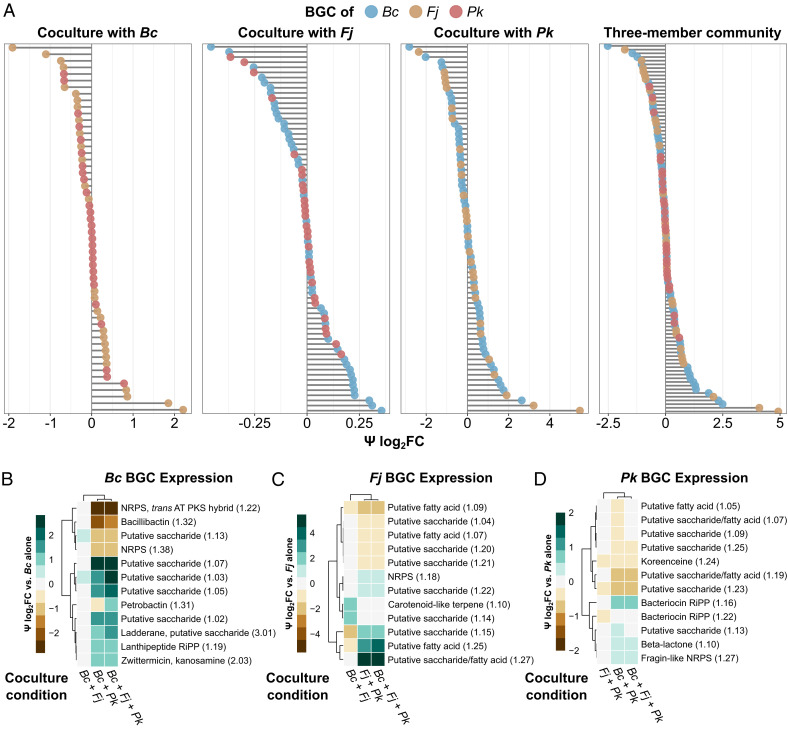
Fig. 1.
Interspecies coculture affects the expression of BGCs in a model community. (A) BGCs of Bc, Fj, and Pk are expressed at different levels when in pairwise or three-member coculture with each other. Psi log2(fold change) is calculated as the fold change of the coculture condition compared to the BGC-containing strain in monoculture. BGCs of Bc, Fj, and Pk are shown in blue, tan, and red, respectively. (B–D) The 12 most differentially expressed BGCs of Bc (B), Fj (C), and Pk (D) as heatmaps, with green indicating increased expression in coculture, brown indicating decreased expression in coculture, and light gray indicating no change. Columns denote coculture conditions, and rows denote individual BGCs and their antiSMASH region numbers in parentheses. SI Appendix, Fig. S2 shows all BGCs in all three strains.

