Fig. 1.
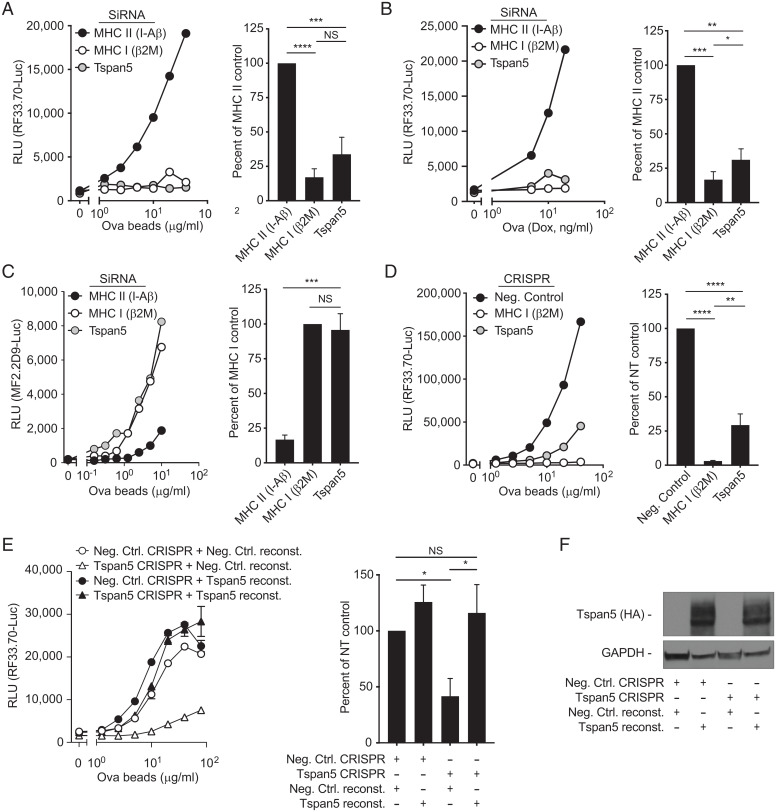
Loss of Tspan5 expression selectively inhibits MHC class I presentation. (A) DC3.2 cells were treated with siRNA for the MHC class II gene H-2 I-A β-chain (black), the MHC class I light chain β2M (white), or Tspan5 (gray). A titration of Ova-conjugated beads was cultured with these DCs and the CD8+ T cell hybridoma RF33.70-Luc and after 16 h, cross-presentation was assayed by measuring luciferase activity. The line graph shows an antigen titration for a representative experiment and the bar graph shows averages of greater than or equal to three experiments taken at a single antigen dose. (B) Similar to A, except instead of Ova-beads, endogenous cytosolic Ova (NS-Ova) expression was induced in DC2.4 cells using doxycycline for 4 h, at which time BFA (to block further egress of pMHC I complexes) and CD8 T cells were added for the remaining 16 h. (C) Similar to A, except instead of measuring MHC I presentation, MHC II presentation was measured with the CD4+ hybridoma MF2.2D9-Luc and siRNA for β2M (MHC I, white) was used as the negative control. (D) Cross-presentation was assessed in DC3.2 cells gene-edited with CRISPR/Cas9 transduction without a guide (Neg Control, black), with guides targeting β2M (MHC I (white), or with guides targeting Tspan5 (gray). Ova-beads were used as a source of antigen and assayed as described in A. (E) DCs were transfected with Cas9, without guide RNA (Neg Ctrl. CRISPR, circle) or with Tspan5 targeted guides (Tspan5 CRISPR, triangle) as shown. Neg Control or Tspan5 knockout DCs were then transfected with an empty plasmid (Neg. Ctrl. reconst.) or with a mutant form of Tspan5 that cannot be targeted by Tspan5 guide RNAs (Tspan5 reconst.) and presentation of Ova was assayed as in D. Left graph shows representative data over a dose range of Ova-conjugated beads, while the Right bar graph shows luciferase activity normalized to the nontargeting control with the mean + SD from three independent assays. (F) Western blot of lysates from DCs shown in D were probed for the Tspan5 expression (HA-tag). (GAPDH serves as the loading control). T cell activation was assessed by the production of luciferase under control of an NFAT promoter in all assays. RLU refers to luciferase activity expressed as relative light units. Data in A–D are representative of greater than or equal to three independent experiments. Statistics were calculated from independent experiments using one-way ANOVA. P values were based on Tukey’s multiple comparison test; NS = not significant, *P < 0.05, **P < 0.01, ***P < 0.001, ****P < 0.0001.

