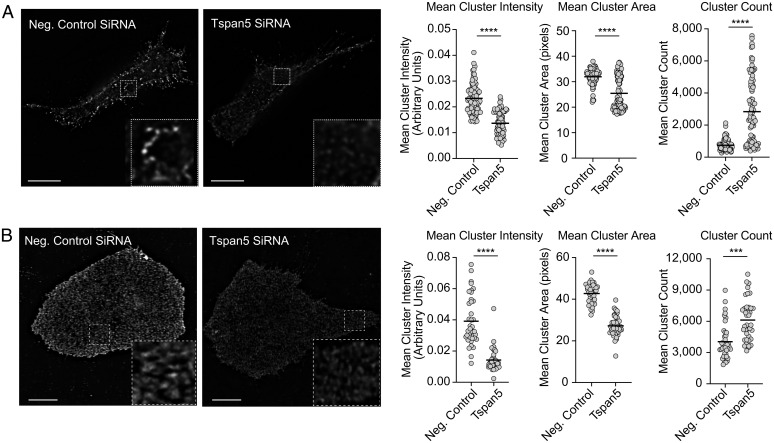
Fig. 5.
Tspan5 regulates MHC class I receptor organization. (A) DC2.4 cells were transfected with siRNA targeting Tspan5 or the MHC II IA beta chain (Neg. Control SiRNA). The distribution of H-2K molecules on the cell surface was assessed using fluorophore conjugated Fab-fragment (Y3-Fab). Fluorescent images were acquired from multiple 0.125-μm z-sections followed by deconvolution using the DV OMX V4 microscope, as described. Images shown are representative of membrane staining at the coverslip. (Scale bar, 10 µm.) Inset images (4.2x magnification) show representative differences in cluster intensity and size. Graphs show the mean intensity of MHC I clusters per cell from representative experiments (arbitrary units, Left graph), mean area of MHC I clusters (pixels, Center graph), or cluster count (Right graph). Data in the graphs are from >45 independent images and are representative of ≥3 independent assays. (B) Similar to A except using human U2OS cells instead of DC2.4 cells and a fluorophore conjugated Fab-fragment (W6/32-Fab) instead of Y3-Fab. Magnification shown in B is 3.3x. (Scale bar, 10 µm.) P values determined by two-tailed, unpaired t test; ***P < 0.001, ****P < 0.0001.

