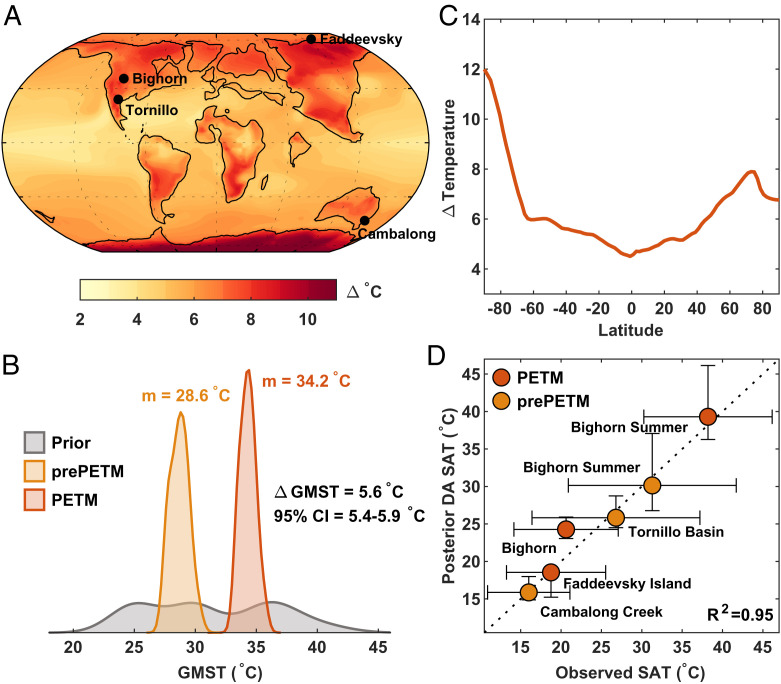
Fig. 2.
Temperature changes during the PETM event. (A) Mean annual surface air temperature anomalies during the PETM, relative to the pre-PETM state, overlain with the locations of the terrestrial temperature proxy data plotted in D. (B) Kernel density estimates of GMST in the model prior simulations (gray) and in the posterior DA solutions for the pre-PETM (orange) and PETM (red). Median ΔGMST for the PETM – pre-PETM and the 95% CI are also shown. (C) Zonal mean annual surface air temperature change. (D) Validation of PETM-DA surface air temperature (SAT) against independent terrestrial temperature proxies; error bars represent 95% CIs (Dataset S2 and SI Appendix).

