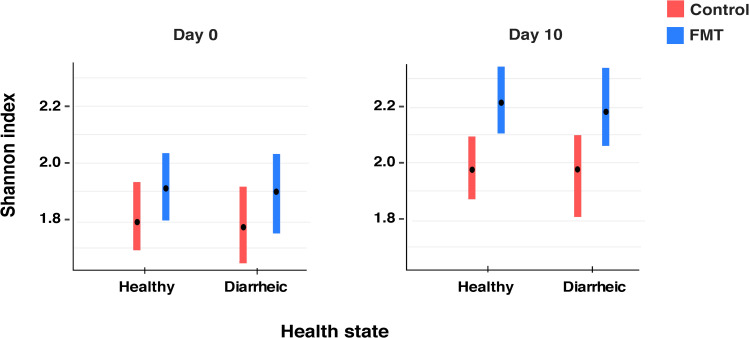
Fig 2. Alpha-diversity analysis using Shannon index.
Samples were grouped by treatment and health status. Day 0 reflects the day of enrollment when calves were first sampled and FMT calves received their first dose of FMT. Day 10 reflects the second sampling time, 9 days after enrollment of both groups. The bars indicate the 95% confidence intervals.

