Figure 2.
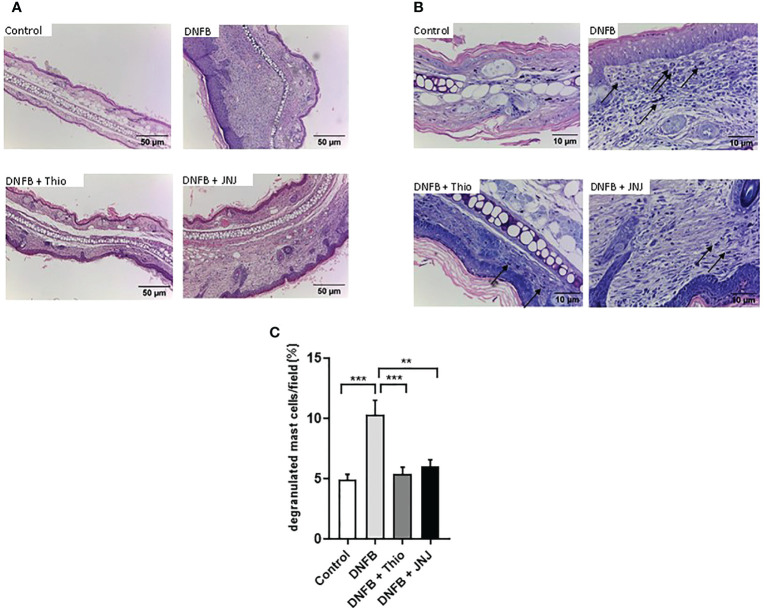
(A) Microscopic analysis of topical tissue stained with hematoxylin and eosin (×10 magnification). (B) Degranulated mast cells stained with Giemsa are indicated by arrows (×40 magnification). Representative micrographs of three independent experiments are shown. (C) Degranulated mast cells in tissue sections of the ear were counted in four fields chosen at random. Data are presented as the mean ± SEM of three independent experiments using three mice. **p < 0.005; ***p < 0.001.

