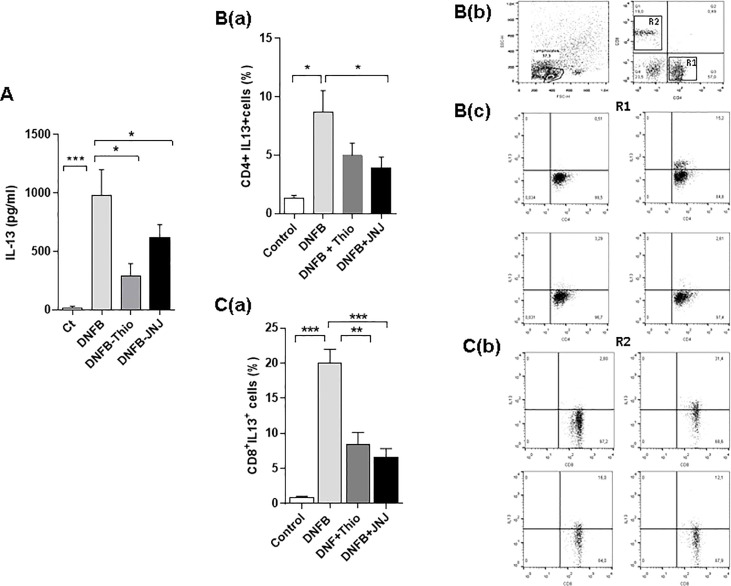
Figure 3.
Blockade of H3R and H4R decreases the production of IL-13 in T lymphocytes. The determinations were made after 24 hours of stimulation of the cells with PMA (10 ng/ml) + ionomycin (1 ng/ml). (A) Quantification by ELISA in culture supernatants is shown. *p < 0.05; ***p>0.001. ANOVA with Tukey’s post-test (n = 7). The content of IL-13 in R1, corresponding to CD4+ cells (B, panel a), and in R2, corresponding to CD8+ (C, panel a) lymphocytes, is shown. The intracytoplasmic marking and flow cytometry, in the presence of brefeldin (10 µg/ml). The cells were permeabilized and labeled with PE-labeled IL-13 antibody. Bars represent the mean + SEM. *p < 0.05; **p>0.01; ***p < 0.001. ANOVA with Tukey’s post-test (n = 9). A representative fluorescence dot plot of CD4+ (B, panel c) and CD8+ (C, panel b) lymphocytes is shown.

