Figure 4.
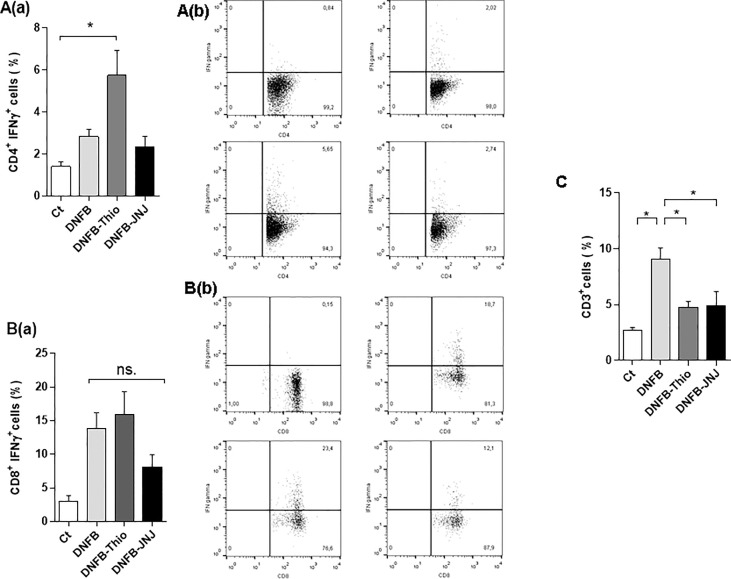
Analysis of the induction of a Th1/Tc1 profile. The bars represent mean ± SEM IFN-γ production by CD4+ (A, panel a) and CD8+ (B, panel a) cells in the gate of CD4 and CD8 lymphocytes, respectively. The intracytoplasmic determination was made from leukocytes from draining lymph nodes of treated mice after being cultured for 24 hours with PMA (10 ng/ml) + ionomycin (1 ng/ml), with the addition of 10 µg/ml brefeldin A (Golgi plug). Permeabilized cells were stained with PE-labeled IFN-γ. *p < 0.05. ANOVA with Tukey’s post-test (n = 8). A representative dot plot of CD4+IFN-γ+ (A, panel b) and CD8+IFN-γ+ (B, panel b) cells is shown. (C) The percentage of T lymphocytes (CD3+) at the administration site. Bars represent the mean ± SEM. ns (not significant); *p < 0.05. ANOVA with Tukey’s post-test (n = 9).

