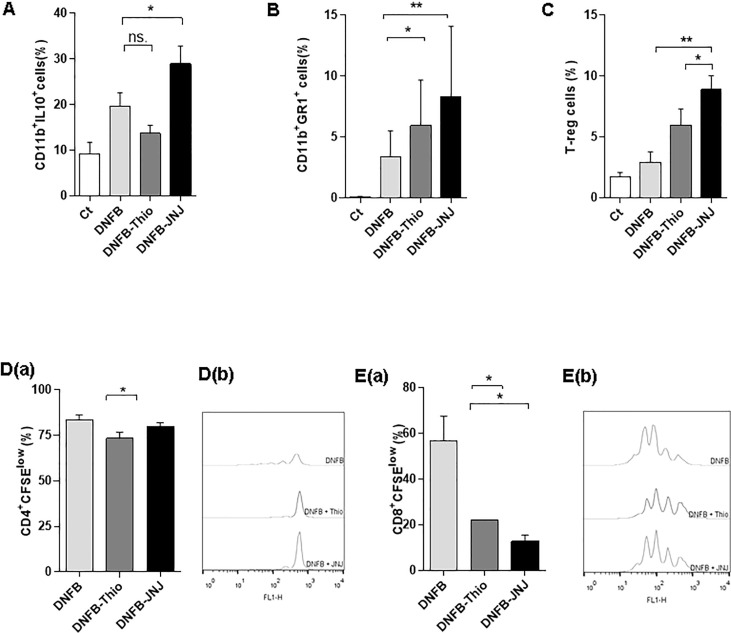
Figure 6.
Induction of a regulatory phenotype in the presence of HA antagonists. (A) Intracytoplasmic staining of mononuclear cells stimulated in vitro for 24 hours with PMA (10 ng/ml) + ionomycin (1 ng/ml). Cells were treated with brefeldin for 6 hours, permeabilized, and then IL-10 was labeled and the cells were counted in a cytometer. Evaluation of proportion of myeloid cells (B) and regulatory T cells in permeabilized cells (C) from draining lymph nodes. (D, E, panel a) The determination of proliferation by dilution of CFSE is shown. Lymph node cells were labeled with the fluorescent dye CFSE and incubated for 96 hours in the presence of anti-CD3 (0.1 μg/ml) that was applied to the plate. A representative dot plot shows CD4 (D, panel b) and CD8 lymphocytes (E, panel b). Bars represent the mean ± SEM. ns (not significant); *p < 0.05; **p < 0.01. ANOVA with Tukey’s post-test (n = 9).

