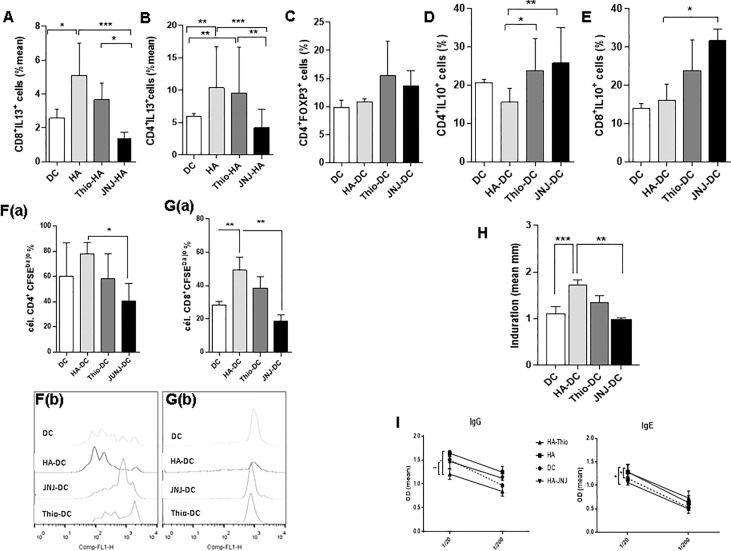
Figure 7.
Blockade of signaling by blocking the H4R on DCs results in a tolerogenic profile. (A, B) The intracytoplasmic content of IL-13 is shown. Lymphocytes from draining lymph nodes were cultured for 24 hours with PMA (10 ng/ml) + ionomycin (1 ng/ml), with the addition of brefeldin A (10 µg/ml). Finally, cells were permeabilized and stained (C) FOXp3+CD4+ regulatory T cells stained from the draining lymph nodes of treated mice. Cells were permeabilized, then stained with the corresponding antibodies and analyzed by cytometry (n = 6). (D, E) IL-10 intracytoplasmic determination in lymphocytes cultured for 18 hours with PMA (10 ng/ml) + ionomycin (1 ng/ml), with the addition of brefeldin (10 µg/ml). Finally, cells were permeabilized, labeled, and analyzed by cytometry (n = 6). (F, G, panel a) Proliferation of leukocytes from the lymph node is shown. Cells were labeled with the fluorescent dye CFSE and incubated in plates pretreated with anti-CD3 (0.1 µg/ml). Ninety-six hours later, cells were analyzed by cytometry (n = 3). A representative experimental histogram is shown for CD4 and CD8 cells (F, G, panel b). (H) Induration was measured after 9 days of DC treatment. (I) Quantification of allergen-specific antibodies measured in serum of treated mice (n = 7). Bars represent the mean ± SEM. *p < 0.05; **p > 0.01; ***p < 0.001. ANOVA with Tukey’s post-test.

