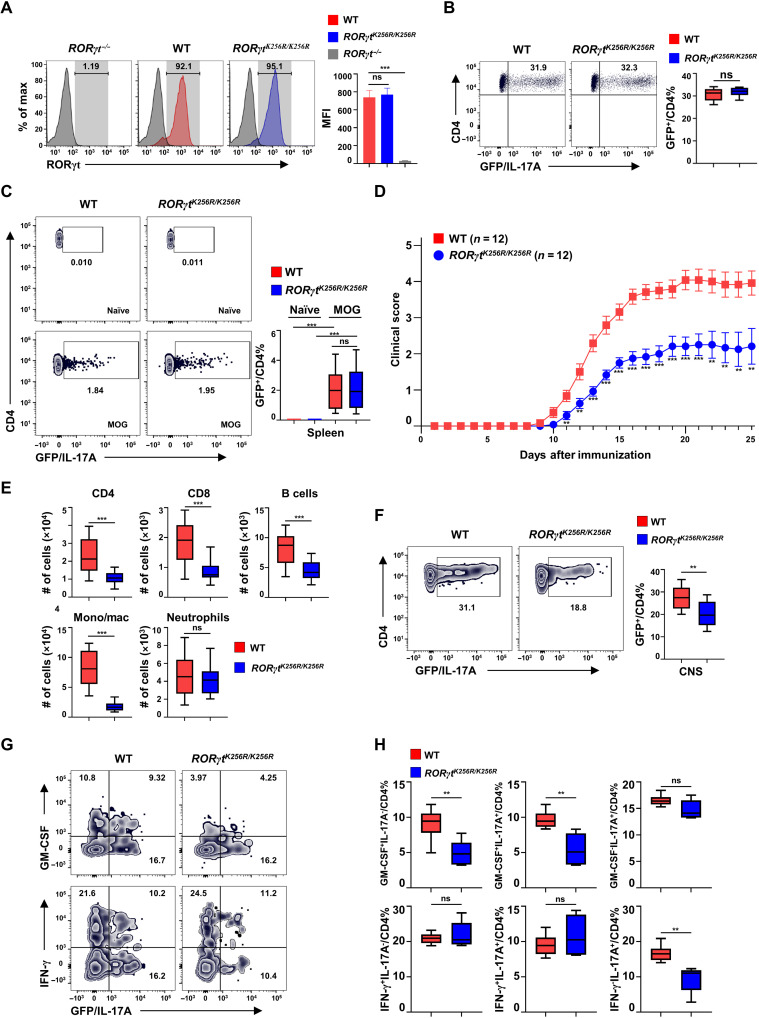
Fig. 4. RORγtK256R/K256R mice have normal TH17 differentiation but develop impaired TH17-dependent EAE.
(A) Flow cytometric analysis of RORγt in WT and RORγtK256R/K256R CD4+ T cells polarized for 3 days under TH17 conditions (n = 4 to 6 per genotype). Bars are means ± SEM. (B) Flow cytometric analysis of GFP+ (IL-17A+) cells among CD4+ T cells from indicated genotypes of cells differentiated under TH17 conditions as described in (A) (n = 4 per genotype). (C) Representative flow cytometric analysis of IL-17A+ cells among CD4+ T cells in the spleen of indicated genotype of mice either before (naïve) or 12 days after MOG35–55 immunization (n = 4). (D) Mean clinical score of indicated mice different days after MOG35–55 immunization. Bars are means ± SEM. (E) Number of indicated immune cells recovered from the CNS of indicated EAE-induced mice from (D). (F) Representative flow cytometric analysis of GFP+ (IL-17A+) among CD4+ T cell infiltrate to the CNS of indicated mice shown in (D) (n = 10 per genotype). (G) Representative flow cytometric analysis of GM-CSF or IFN-γ expression in the lymphocyte infiltrated to the CNS of indicated mice shown in (D). (H) Quantification of GM-CSF+/CD4+ % and IFN-γ+/CD4+ % cells in the CNS (n = 5 per genotype). **P < 0.01; ***P < 0.001 (two-tailed t test). (E, F, and H) Box plots: Median (central line), maximum, minimum (box ends), and outliers (extended lines).

