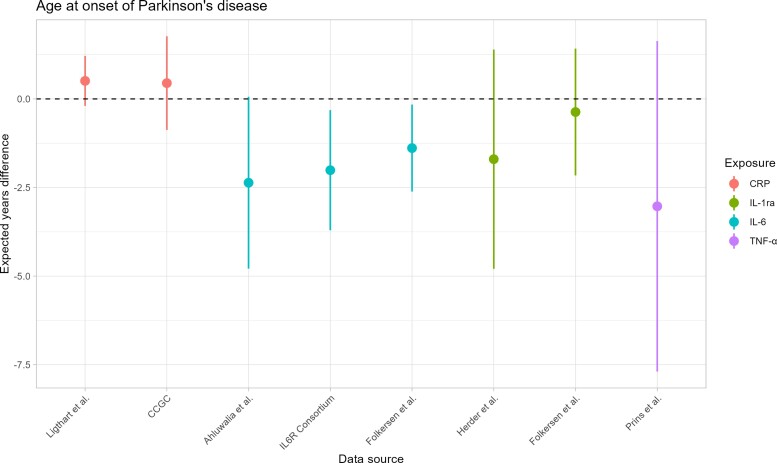
Figure 3.
MR estimates for Parkinson’s disease-AAO. On the x-axis, the data sources are depicted. On the y-axis, the estimated Parkinson’s disease-AAO differences are shown. Points represent the estimated Parkinson’s disease-AAO differences of the effect of the exposure on Parkinson’s disease-AAO, whereas the lines represent the 95% CIs of the point estimate. Each colour identifies an inflammatory biomarker. The dashed line represents the situation of absence of association between exposures and Parkinson’s disease-AAO, i.e. estimated Parkinson’s disease-AAO difference = 0.

