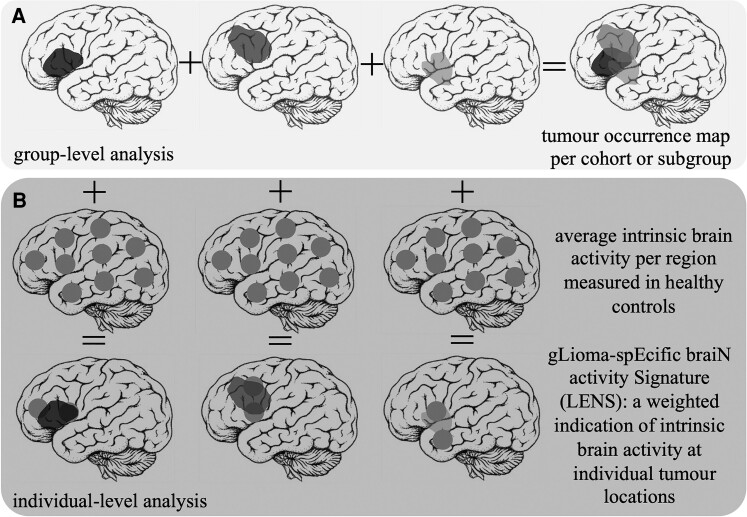
Figure 1.
Schematic overview of patient-related analyses. (A) The construction of the tumour occurrence map per cohort or subgroup by summation of all tumour masks in template space is depicted. (B) Individual tumour masks are overlaid with regional brain activity values of healthy controls. Brain activity values are then weighted according to per cent overlap with the tumour, and the ultimate average LENS is normalized for the total number of regions overlapping with the tumour.

