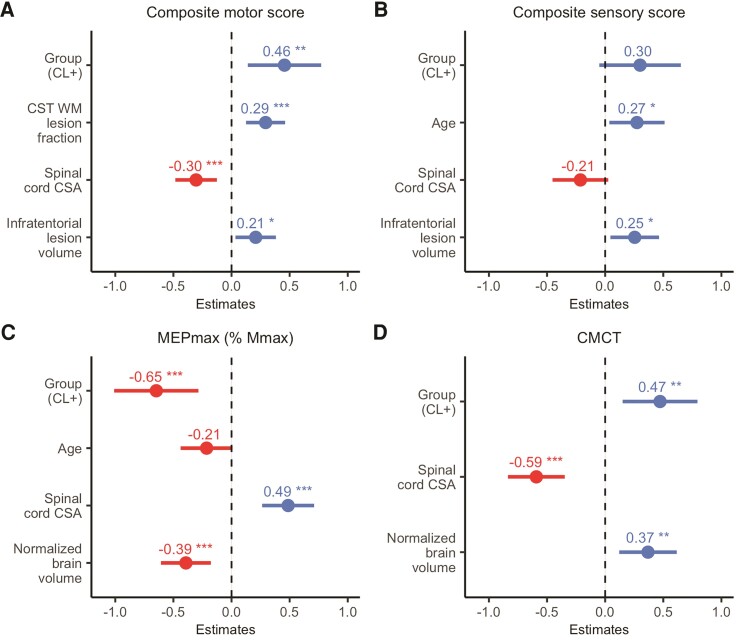
Figure 3.
Stepwise mixed linear regression models. Standardized β-coefficients (dots) and 95% standardized CIs of effect size (lines) are plotted for each variable included from the stepwise mixed linear regression models. (A) Composite motor score; (B) composite sensory score; (C) MEPmax; (D) CMCT. Negative and positive values denote a negative and a positive relationship, respectively. *P < 0.05, **P < 0.01, ***P < 0.001. WM = white matter; CSA = cross-sectional area.

