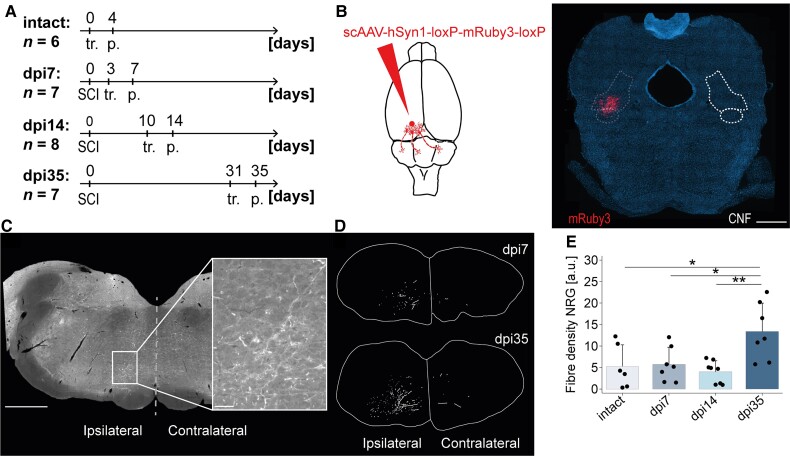
Figure 3.
Delayed hindlimb response to CNF-DBS is paralleled by a lag in anatomical plasticity after T10 injury. (A) Experimental schedule to study CNF plasticity by comparing four groups: intact (n = 6), 7 days after injury (n = 7), 14 days after injury (n = 8), 35 days after injury (n = 7). dpi = day post-injury. tr. = tracing; p. = perfusion. (B) Schematic illustration and representative scAAV-DJ/2-hSyn1-chl-loxP-mRuby3-loxP-SV40p(A) injection site at AP −7.8 confined to the CNF (white dashed line). Scale bar = 1 mm. (C) Representative brainstem cross-section showing descending CNF fibres in the ipsi- and contralateral NRG. Inset shows high magnification of area rich in fibres. Dashed grey vertical line represents midline. Scale bars = 1 mm (overview); 100 µm (inset). (D) Representative reconstructions of CNF fibres in ipsilateral and contralateral NRG at dpi7 and dpi35. (E) Quantification of CNF fibre density in the ipsilateral NRG in intact (n = 6) and injured (dpi7: n = 7; dpi14: n = 8; dpi35: n = 7) animals, normalized to the number of infected cells in the CNF, shows a significant increase in fibre density 35 days after injury. a.u. = arbitrary unit. Dpi7, dpi14 and dpi35 indicate day of perfusion. One-way (group) ANOVA (P < 0.01) followed by Bonferroni post hoc testing. *P < 0.05, **P < 0.01, ***P < 0.001. Data are presented as mean + SD, dots represent single animals.

