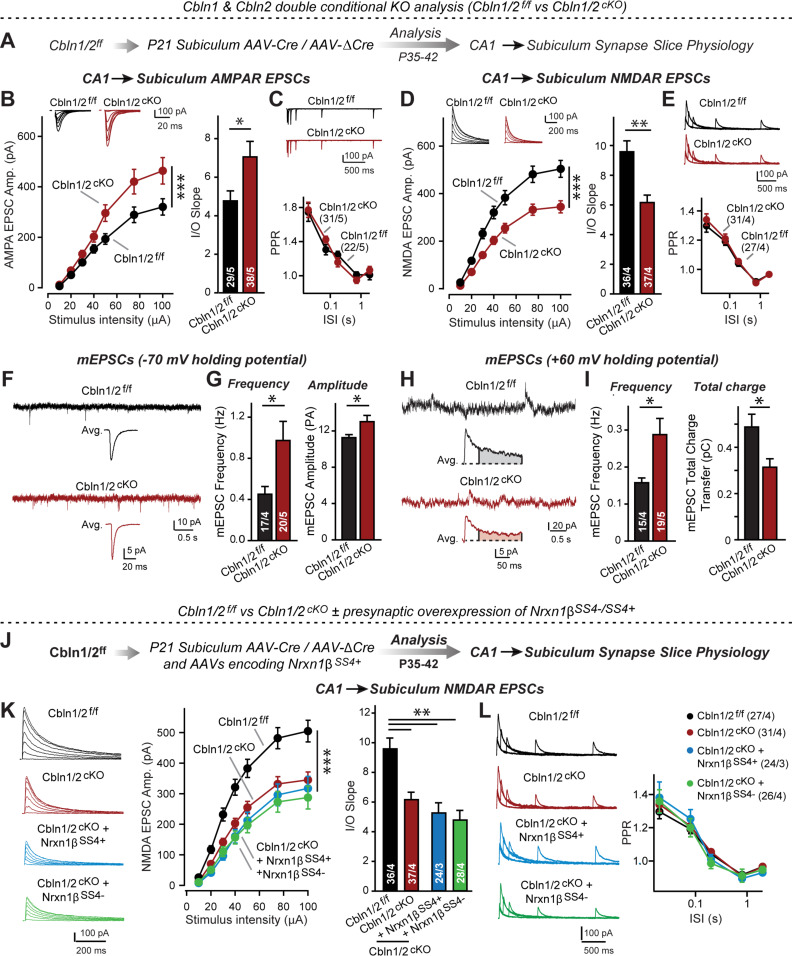
Figure 5. Cbln1 and Cbln2 double KO in the subiculum phenocopies the Cbln2 single KO at CA1→subiculum synapses.
(A) Experimental strategy. AAVs encoding Cre or ΔCre (as a control) were stereotactically injected into the subiculum of conditional KO mice at P21, and mice were analyzed by slice physiology 2–3 weeks later. (B-E) Input/output measurements of evoked EPSCs recorded from combined burst- and regular-spiking neurons in acute subiculum slices reveal that the conditional Cbln2 KO enhances AMPAR-EPSCs (B) without changing the paired-pulse ratio of AMPAR-EPSCs (C) but suppresses NMDAR-EPSCs (D), again without changing the paired-pulse ratio of NMDAR-EPSCs (E). Sample traces are shown above the respective summary plots and graphs. (F-I) Analyses of mEPSCs recorded at –70 mV and +60 mV holding potentials from burst- and regular-firing neurons in the subiculum after deletion of both Cbln1 and Cbln2 reveal an increase in mEPSC frequency measured at both holding potentials, but a decrease in charge transfer only of mEPSCs monitored at a+60 mV holding potential consistent with the decreased NMDAR-EPSC amplitude detected during input/output measurements (F, sample traces; G, bar graphs of the mEPSC frequency and amplitude, respectively; H & I, same as F & G but for recordings at +60 mV). (J) Experimental strategy. The subiculum region of Cbln1/2cKO was bilaterally infected at P21 by stereotactic injections of AAVs expressing ΔCre-eGFP (Cbln1/2f/f) or Cre-eGFP (Cbln1/2cKO), and then two weeks later cohorts of mice injected with Cre were further injected into the CA1 region with AAVs expressing Nrxn1βSS4+ or Nrxn1βSS4-. Mice were then analyzed at P49-P56 by acute slice electrophysiology. (K) Overexpressed Nrxn1βSS4+ no longer enhances NMDAR-ESPCs on the background of the double Cbln1/2 cKO, nor does it reverse the decrease in NMDAR-EPSCs induced by the double Cbln1/2 cKO (left, representative traces; middle, summary plot of the input/output relation; right, summary graph of the slope of the input/output relations). (L) Conditional deletion of both Cbln1 and Cbln2 without or with presynaptic overexpression of Nrxn1βSS4+ or Nrxn1βSS4- does not alter paired-pulse ratios of NMDAR EPSCs. Left panels show sample traces; right panels summary plots of the paired-pulse ratio as a function of the interstimulus interval. Data are means ± SEMs; the number of cells/mice are depicted in the bars. Statistical analyses were performed by two-way ANOVA or unpaired two-tailed t-test comparing KOs to WT (*p≤0.05; **p≤0.01, and ***p≤0.001).


