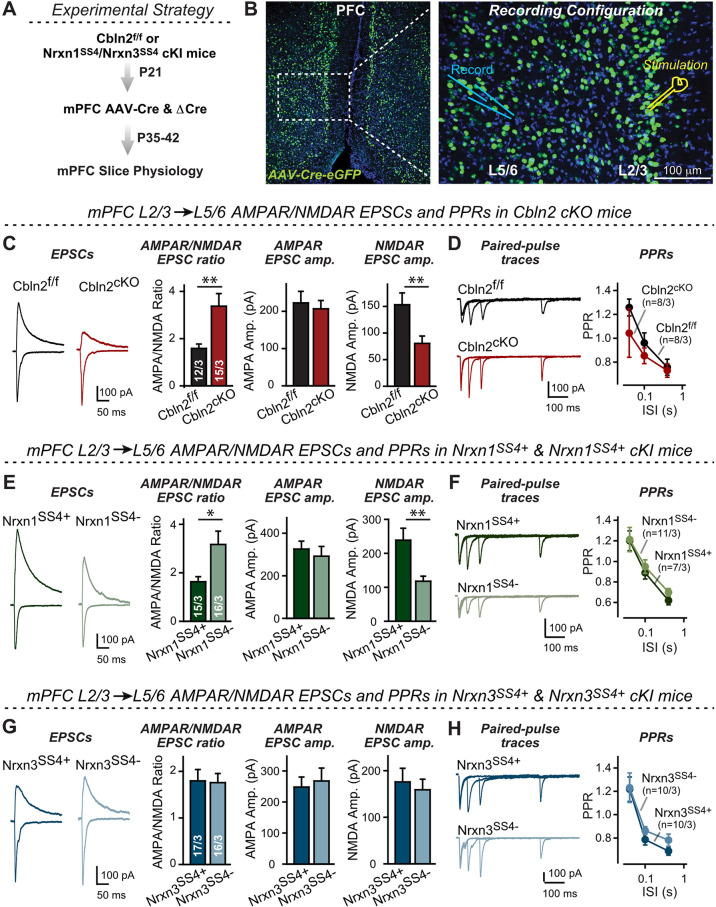
Figure 6. Nrxn1SS4+-Cbln2 signaling controls NMDAR-EPSCs but not AMPAR-EPSCs in the PFC, whereas Nrxn3SS4+-Cbln2 signaling does not regulate either AMPAR- or NMDAR-EPSCs in the PFC.
(A & B) Experimental strategy (left, flow diagram of the experiments); middle and right, Analysis strategies of Cbln2/Nrxn1-SS4/Nrxn3-SS4 conditional KO. Right, the mPFC region of Cbln2cKO was bilaterally infected at P21 by stereotactic injections of AAVs expressing ΔCre-eGFP (Cbln2f/f) or Cre-eGFP (Cbln2cKO), and L5/6 pyramidal neurons in the prelimbic cortex (PL) region were analyzed 2–3 weeks later (A) The stimulation electrode was placed in L2/3 as indicated and applied same stimulation intensity/duration for all groups of mice to keep the consistency (B) C. Left, sample traces of evoked AMPAR- and NMDAR-EPSCs at Cbln2f/f and Cbln2cKO mPFC brain slices; Right, statistics of AMPA/NMDA ratios, AMPAR-EPSCs amplitude, and NMDAR-EPSCs amplitude. (D) Left, sample traces of paired-pulse measurements from each condition; Right, summary plots of PPRs. (E & F) Same as (C & D), but recorded from Nrxn1SS4+ knockin mice in which ΔCre retains a constitutive expression of Nrxn1-SS4+splice variants, whereas Cre converts the Nrxn1-SS4+variants into constitutive Nrxn1-SS4- variants. (G & H) Same as (C & D) but recorded from Nrxn3SS4+ knockin mice in which ΔCre retains a constitutive expression of Nrxn3-SS4+splice variants, whereas Cre converts the Nrxn3-SS4+variants into constitutive Nrxn3-SS4- variants. Data are means ± SEM. Number of neurons/mice are indicated in bars. Statistical significance was assessed by unpaired two-tailed t-test or two-way ANOVA (*P≤0.05, **P≤0.01, and ***p≤0.001).

