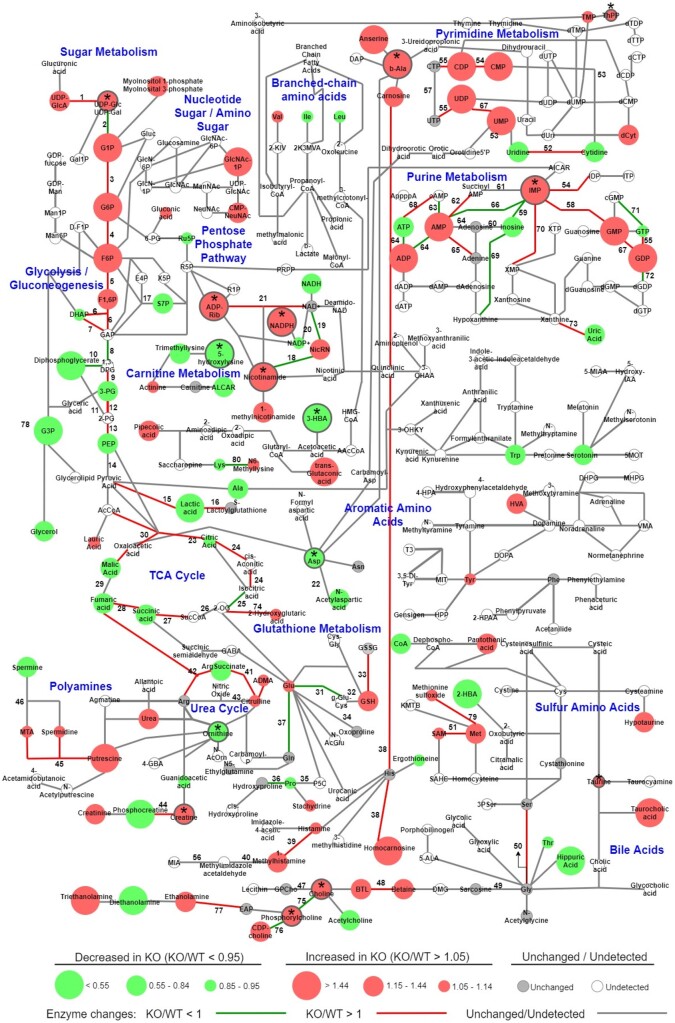
Figure 2.
Ogfod1 deletion leads to changes in the cardiac metabolome. Metabolomics results (circles) from Ogfod1-WT and Ogfod1-KO hearts correlated with the proteomics results (lines connecting the circles) for enzymes responsible for the indicated metabolite connections. Colour and size of circles indicates direction and magnitude of change, while colour of lines indicates the directionality of the protein change as described in the key at the bottom of the figure. Asterisks combined with grey outline of red or green circles indicate significant metabolite changes. n = 4 biological replicates per group. Student’s t-test was used to determine significance between groups. A P-value of <0.05 was considered significant.

