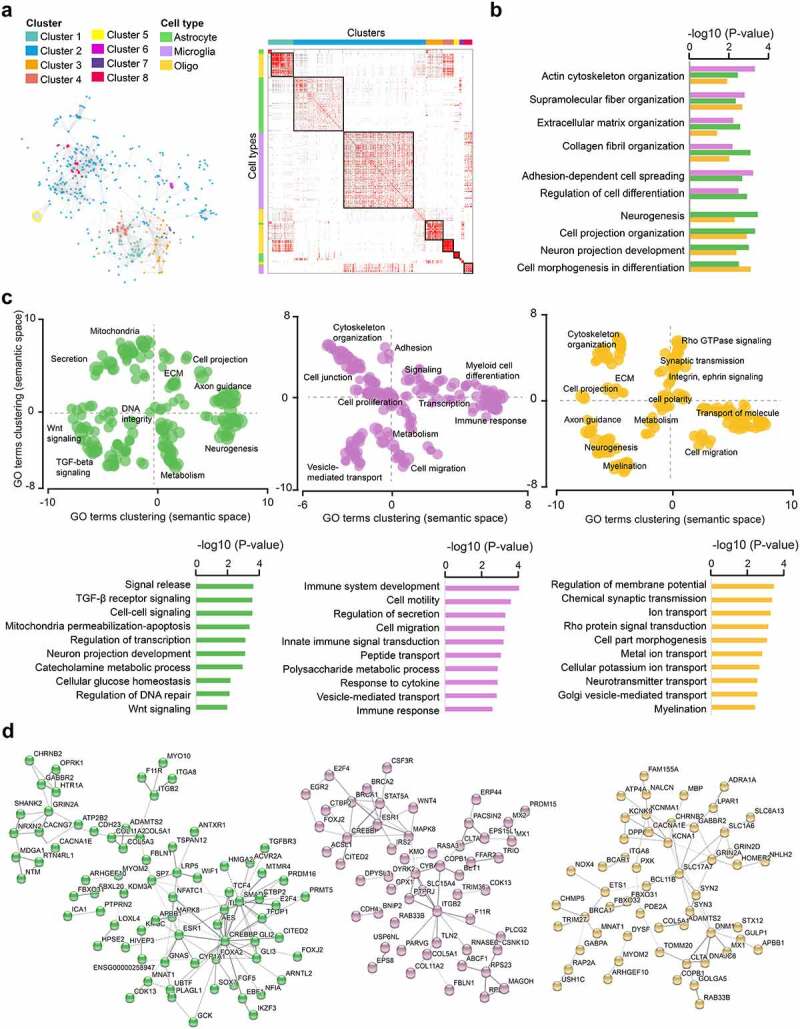
Figure 5.

Cell type-specific functional association of DNA methylation changes in glial cells of Multiple Sclerosis patients. a. Heatmap of significant GO terms related to Biological Processes (min 3 molecules) generated from genes that associate with cell type-annotated DMPs. GO terms were grouped into clusters using the relative risk (RR) between different pathways, which was calculated based on the number of overlapping genes per pathway [55]. The left panel reflects relative distance between GO terms and clusters. b. Significantly enriched biological processes shared by at least 2 out of 3 cell types. c. Scattered plot showing clusters of gene ontology (GO) terms associated with differentially methylated genes (DMP with Padj < 0.05) in MS patients compared to NNC, annotated as expressed in astrocytes (left), microglial cells (middle) and oligodendrocyte (right). Biological Processes GO terms were obtained using over-representation analysis and clusters were visualized in two-dimensional space (assigning x and y coordinates to each term) by applying multidimensional scaling of the matrix of GO terms according to semantic similarity, using REVIGO [54]. The circle size represents −log10 (P-value), with small to big diameters ranging from 1.32 (P = 0.04) to 4.2 (P= 6.5 × 10−05). The top biological processes are displayed in the lower panel. d. Representation of the cell type-restricted genes containing DMPs (Padj < 0.05) involved in the top 50 biological processes from GO analysis in astrocytes (green), microglia (purple) and oligodendrocytes (orange), using STRING network analysis. Grey gradient indicated the strength of data support (darker grey representing stronger evidence, dotted line showing lower level of evidence, i.e., combined interaction score 0.4–0.6). Full GO data are presented in Supplementary Table 5. Astrocytes, microglial cells and oligodendrocyte are depicted in green, purple and orange, respectively.
