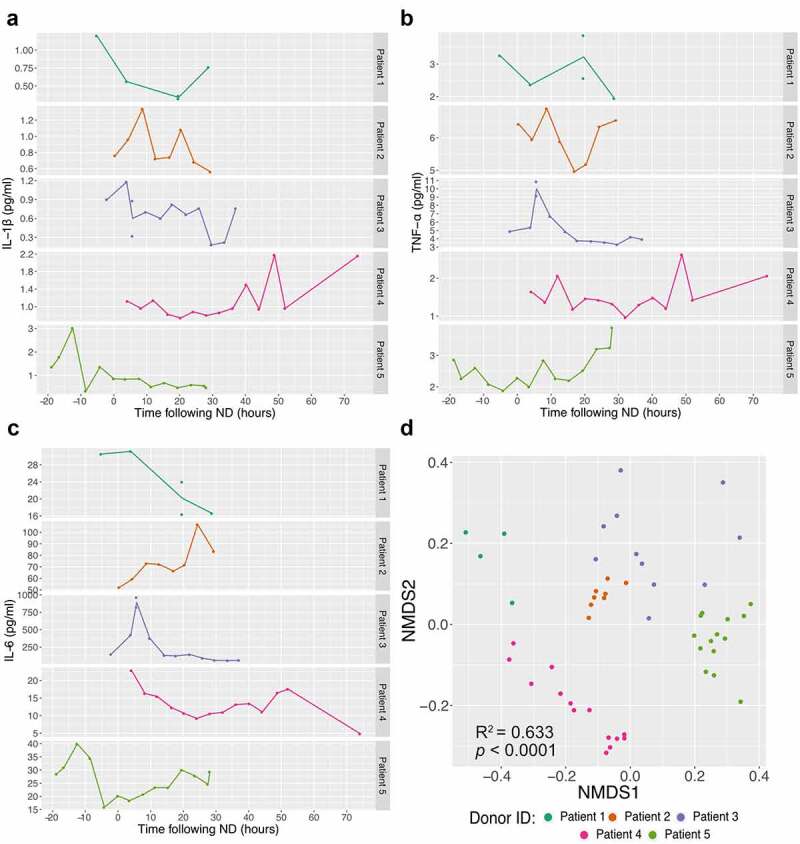
Figure 2.

Inflammatory response in neurological deceased donors. Time course quantification of three cytokines: IL-1β (a), TNF-α (b) and IL-6 (c) highlights the frequent variation within NDDs over time (following neurological death diagnosis). Supplementary Figure 1 displays the others six cytokines quantified. Non-metric multidimensional scaling (NMDS) analysis ordination using the Bray-Curtis dissimilarity metric (quantification of 9 cytokines) between NDDs (d) demonstrates that samples collected from the same individuals tend to cluster together, suggesting higher homogeneity within donor (Stress value = 0.061, PERMANOVA: R2 = 0.633, p < 0.0001). Each point represents one time point and the dataset is coloured by patient.
