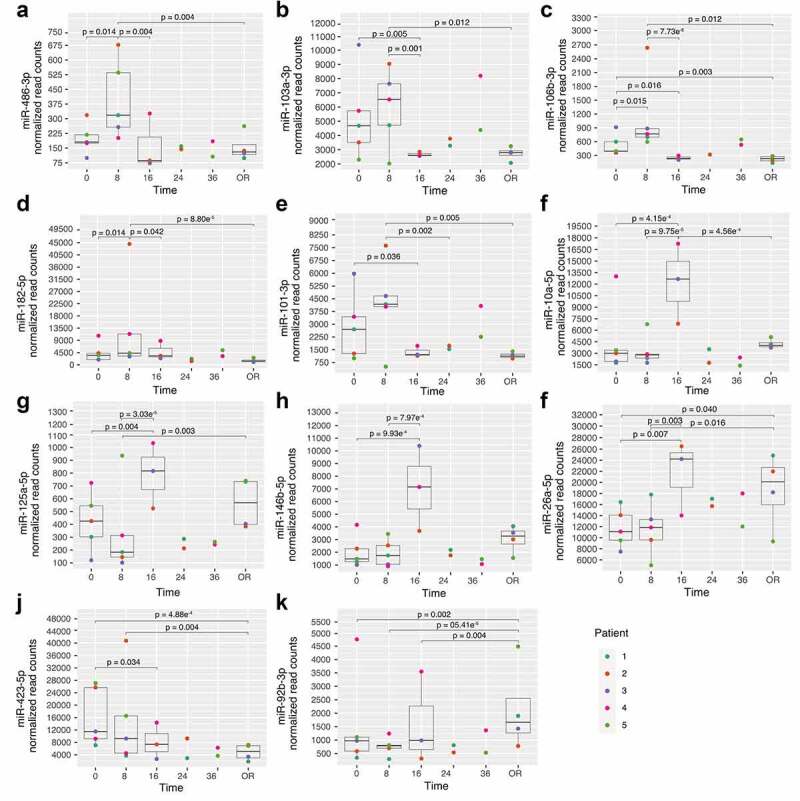
Figure 4.

miRNA showing changes following post-organ donation consent. A-E: miRNAs with changes at 8 h; F-I: miRNAs with changes at 16 h; J-K: miRNAs with continuous changes after ND; OR: Organ recovery. Time is represented as hours post-consent to organ donation. Each colour represents a specific patient and the p-values represent significant differences between each time point read counts.
