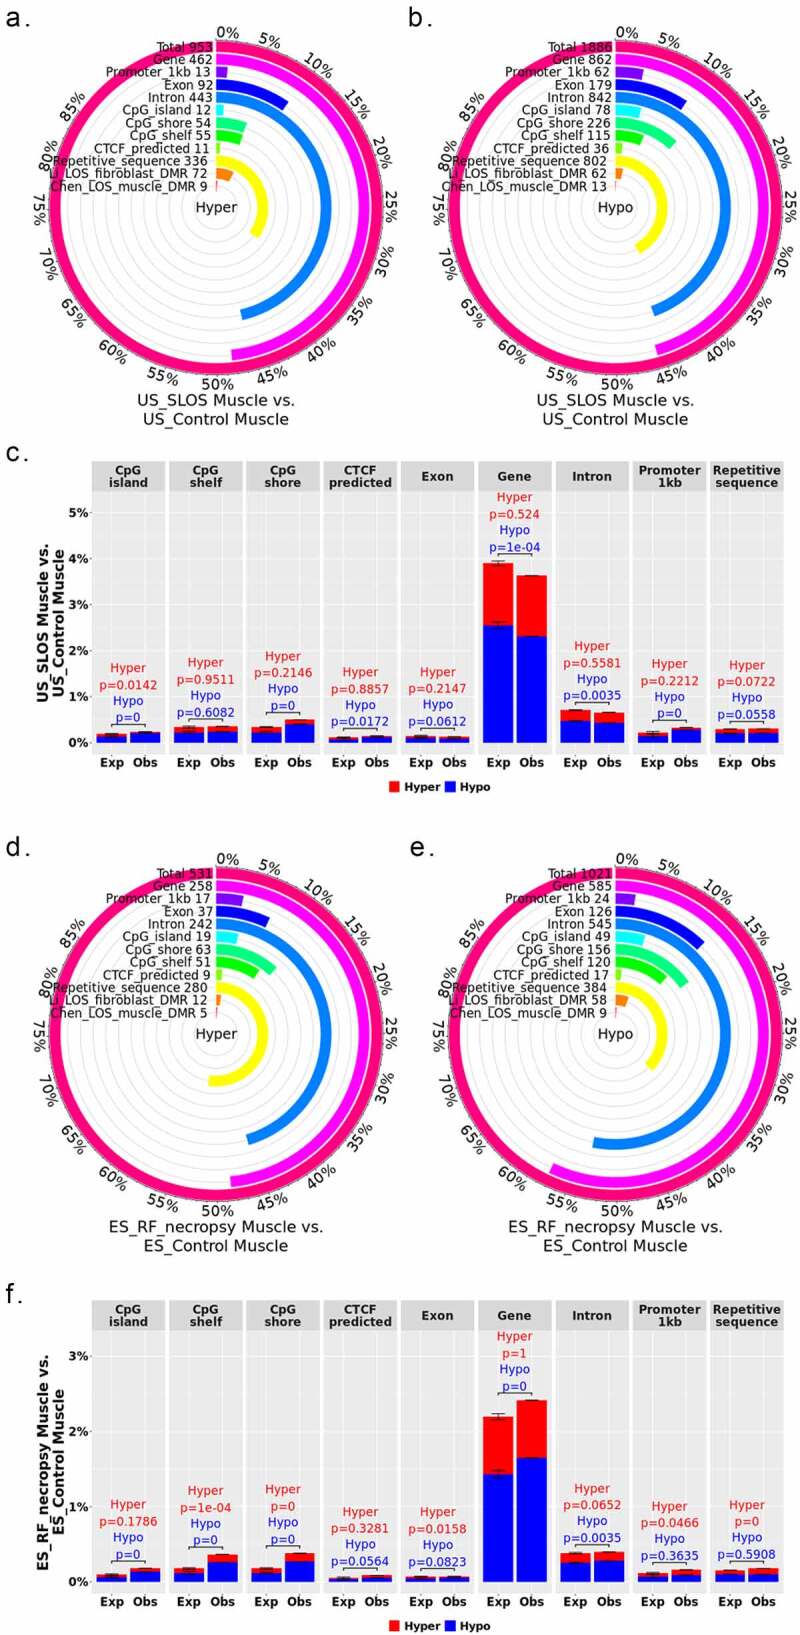
Figure 2.

Distribution of LOS associated differentially methylated regions (DMRs) across various genomic contexts. (a-c) Muscle US_SLOS vs. US_Control DMRs. (d-f) Muscle ES_RF_necropsy vs. ES_Control DMRs. (a-b and d-e) Each figure shows the total number of DMRs in the comparison and the number and percent of the hypermethylated (hyper; a and d) and hypomethylated (hypo; b and e) DMRs over each genomic context. In addition, the figures include the number and percent of DMRs that overlap with two previous studies (Li [25] and Chen [19]) for comparison purposes. (c and f) Percent of the genomic context that overlaps with DMRs. Obs = observed frequencies. Exp = expected frequencies (mean ± standard deviation; obtained from randomly shuffling DMRs across genome 10,000 times). The p values were calculated as p = n(|Exp – mean(Exp)| ≥ |Obs – mean(Exp)|)/10,000.
