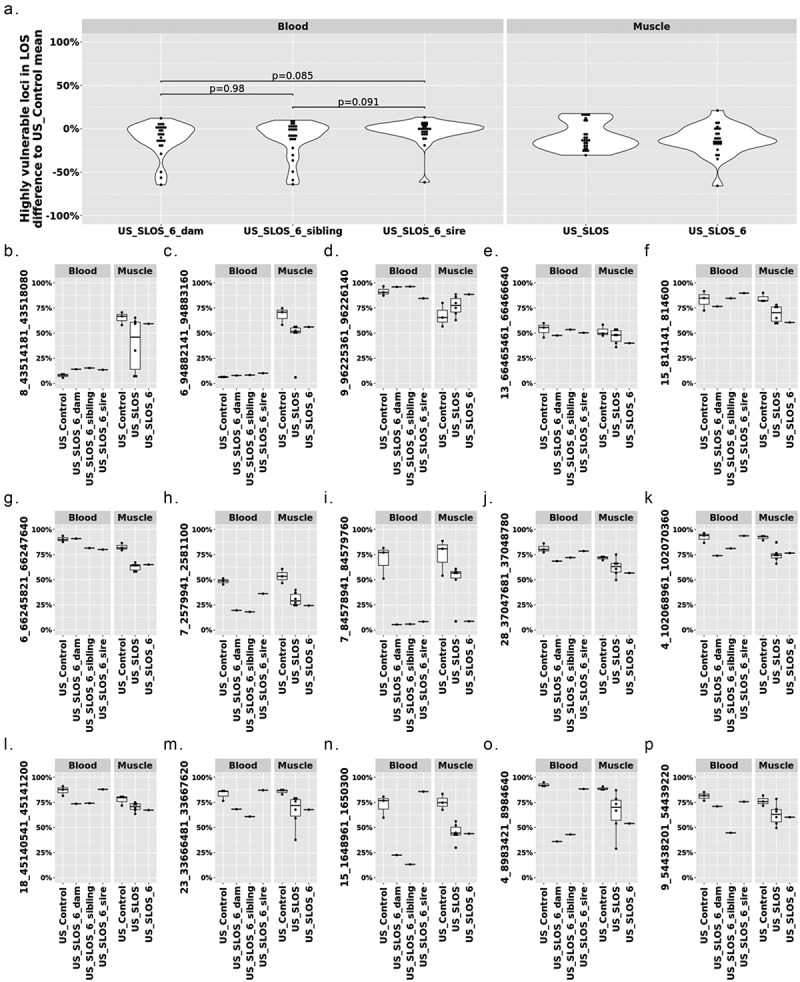
Figure 6.

DNA methylation at the 25 highly vulnerable loci of LOS (≥ 3 experiments) in US_SLOS_#6 calf, its sire, dam, and full-sibling. (a) Violin plots with dots showing the difference of DNA methylation between examined individual/group (mean) and mean of US_Control for highly vulnerable loci in LOS (found in ≥3 LOS experiments). Each dot in the violin plot represents a vulnerable locus. P values were from t-test. The baseline for blood samples is US_Control blood and the baseline for muscle samples is US_Control muscle. (b-p) Box plots with dots show DNA methylation level (y-axis) at highly vulnerable loci without obvious differences (>10%) in parental blood samples (b-f), with obvious differences in sire only (g), both sire and dam (h-i), dam only (j-o), and sibling only (p) when compared to the mean of control group. Each dot in the box plot represents a sample.
