Figure 3.

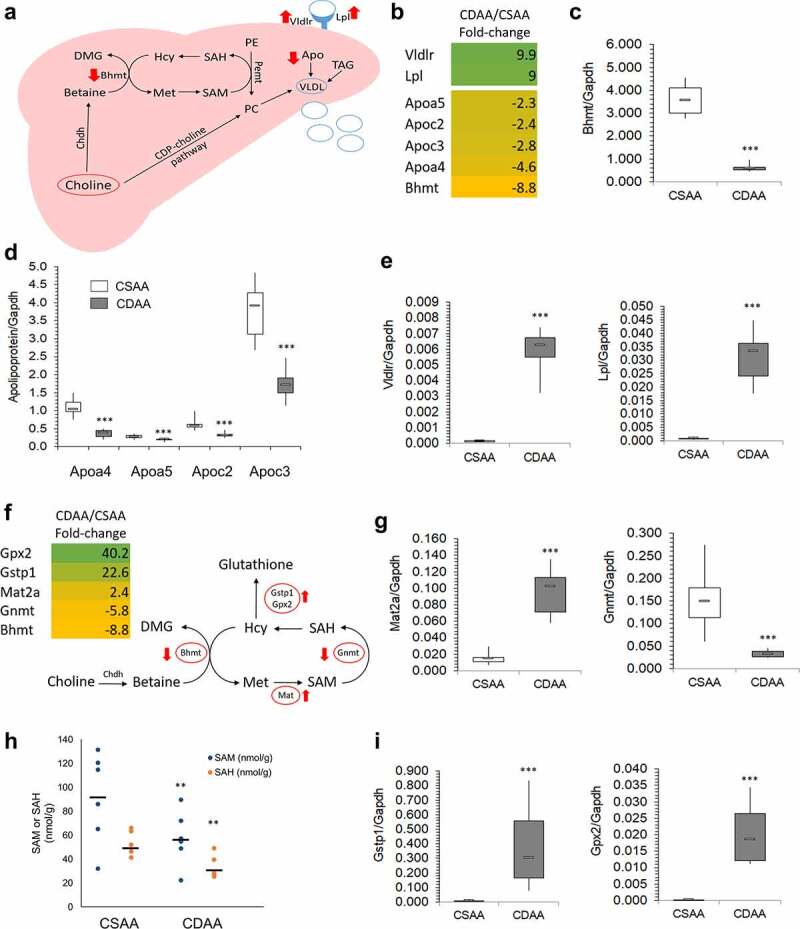
Lipid distribution and one-carbon metabolism pathways are altered upon carcinogenic choline-deficient diet. (a) Schematic of a lipid distribution pathway in the liver that is linked to choline metabolism. Red arrows indicate the direction of changes in gene expression as determined by RNA-seq and qRT-PCR. (b) Heat map based on fold-change values in RNA-seq for differentially expressed genes that are associated with a lipid distribution-related pathway (n = 4/group). (C, D, E) Boxplots depicting expression of Bhmt (c), apolipoproteins Apoa4, Apoa5, Apoc2, and Apoc3 (d), and Vldr and Lpl (e), on mRNA levels as validated by qRT-PCR in CSAA and CDAA livers. Results expressed as min, IQR, and max; n = 6 rats per group. ***P < 0.001. (f) Heat map based on fold-change values in RNA-sequencing for differentially expressed genes that are associated with a one-carbon metabolism pathway (n = 4/group). Schematic of one-carbon metabolism is shown in the right panel and red arrows indicate the direction of changes in expression of genes involved in the pathway. (g) Boxplots depicting expression of Mat2a and Gnmt on mRNA levels as validated by qRT-PCR in CSAA and CDAA livers. Results expressed as min, IQR, and max; n = 6 rats per group. ***P < 0.001. (h) SAM and SAH levels measured by liquid-chromatography mass-spectrometry (LC-MS)-based method in CSAA and CDAA livers. Results expressed as scatter plots; n = 6 rats per group. **P < 0.01 (CDAA vs. CSAA). (i) Boxplots depicting expression of Gstp1 and Gpx2 on mRNA levels as validated by qRT-PCR in CSAA and CDAA livers. Results expressed as min, IQR, and max; n = 6 rats per group. ***P < 0.001.
