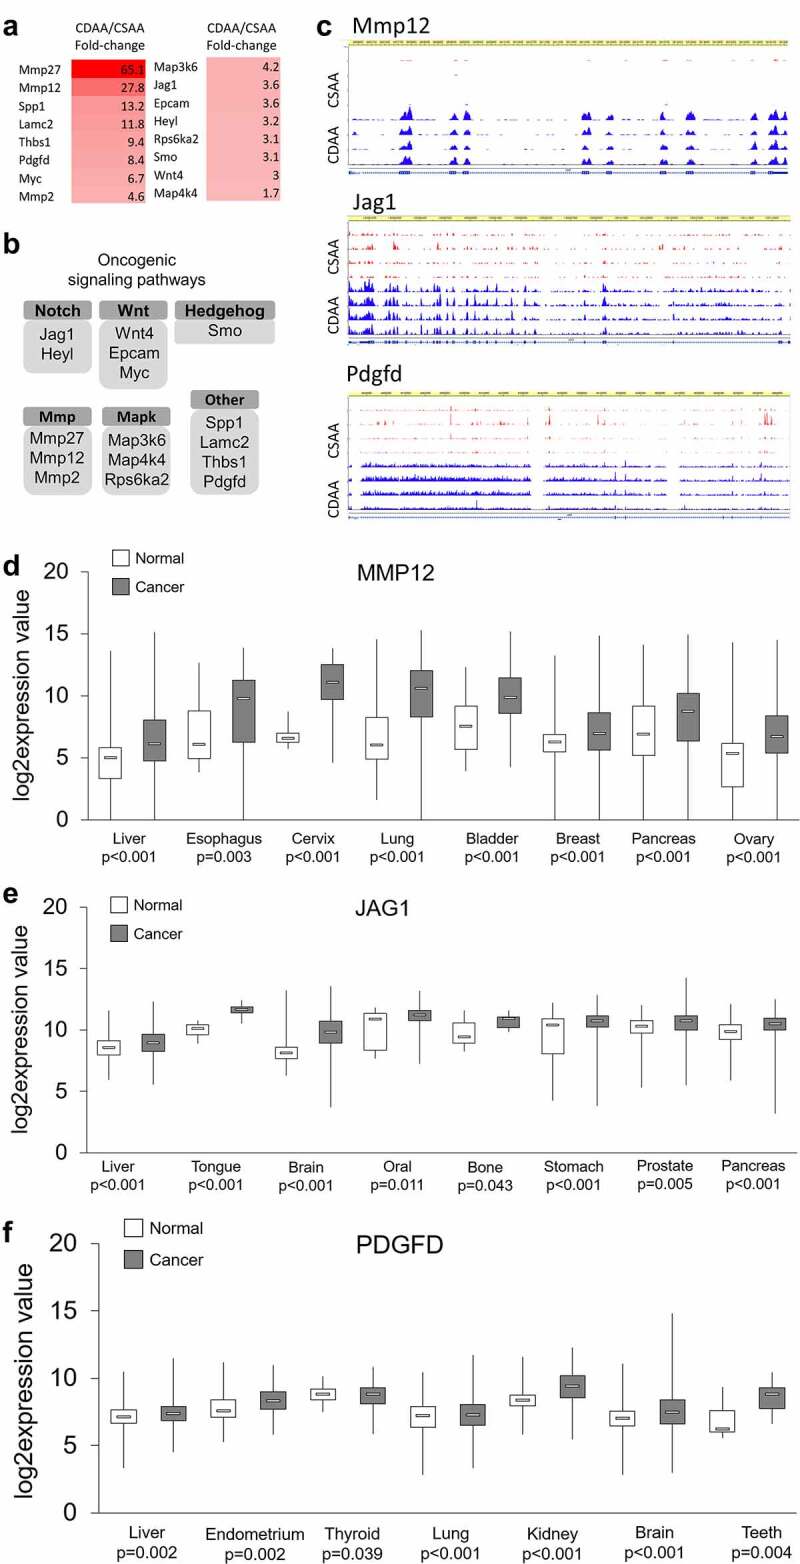
Figure 4.

Upregulated oncogenes and oncogenic pathways in CDAA livers. (a) Heat map based on fold-change values in RNA-seq for differentially expressed genes with oncogenic functions (n = 4/group). (b) The differentially expressed oncogenes categorized into oncogenic signalling pathways based on GO function and KEGG pathway analyses generated by DAVID Knowledgebase.(c) Tracks depicting RNA-seq data for several top upregulated oncogenes, Mmp12, Jag1, and Pdgfd, generated using WashU Epigenome Browser. Red peaks indicate CSAA reads and blue peaks indicate CDAA reads from 4 rats per group which were analysed by RNA-seq. (d-f) Boxplots depicting publicly available data on expression of MMP12, JAG1 and PDGF in clinical samples in different types of cancer. The normal versus tumour gene expression data were obtained from Oncomine and GENT2 and are presented as log2-transformed median centred per array, and SD-normalized to 1 per array. All the presented changes are presented with a corresponding statistical significance level (P value).
