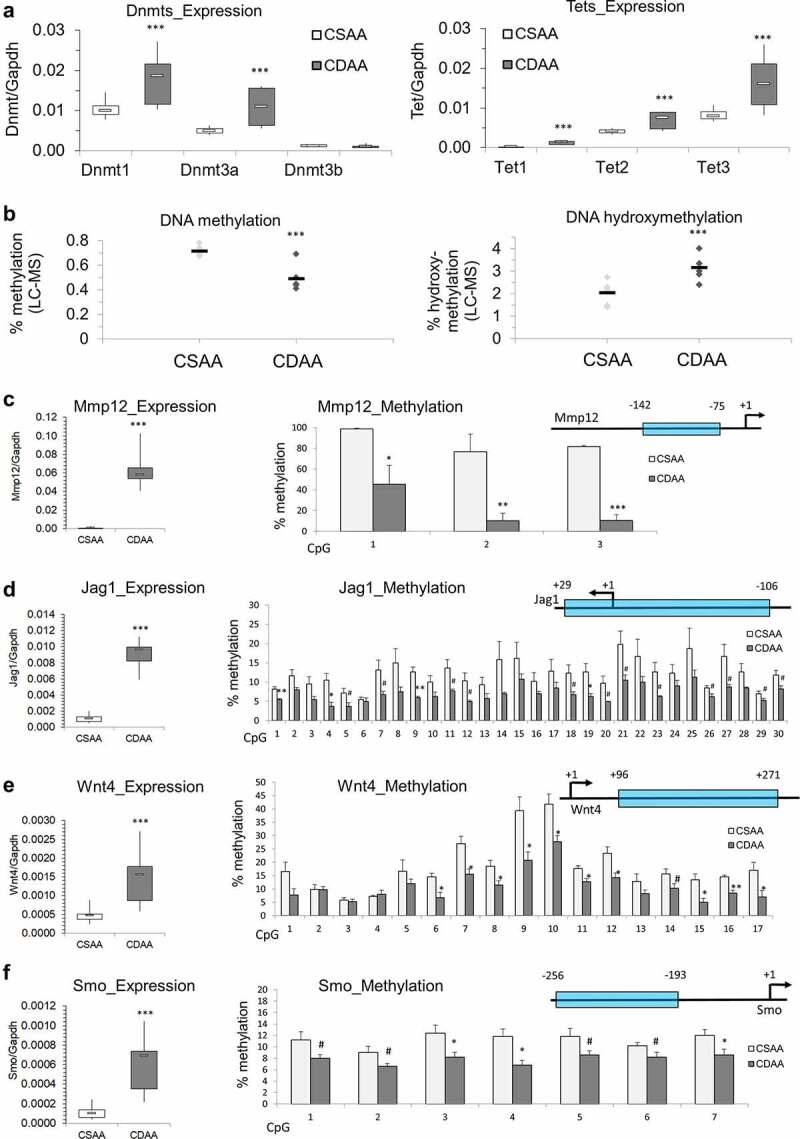
Figure 5.

Dysregulation of DNA methylating and demethylating enzymes, and DNA hypomethylation of promoter regions of candidate oncogenes that are overexpressed in liver of rats exposed to carcinogenic choline-deficient diet. (a) Boxplots depicting expression of methylating enzymes Dnmts and demethylating enzymes Tets on mRNA levels as validated by qRT-PCR in CSAA and CDAA livers. Results expressed as min, IQR, and max. (b) Global levels of DNA methylation and DNA hydroxymethylation in CSAA vs. CDAA livers, as measured by liquid-chromatography mass-spectrometry (LC-MS)-based method in CSAA and CDAA livers. (c-f) The left panels show gene expression of Mmp12 (c), Jag1 (d), Wnt4 (e), and Smo (f), as measured by qRT-PCR in CSAA vs. CDAA livers. DNA methylation levels, as measured by pyrosequencing, are depicted in the right panels, along with maps of the tested regions. Numbers represent locations of first and last CpG sites relative to the transcription start site (TSS) (+1) within the tested region. Results are expressed as mean ± SD; n = 6 rats per group. # P < 0.1, *P < 0.05, **P < 0.01, ***P < 0.001.
