
Figure 2.
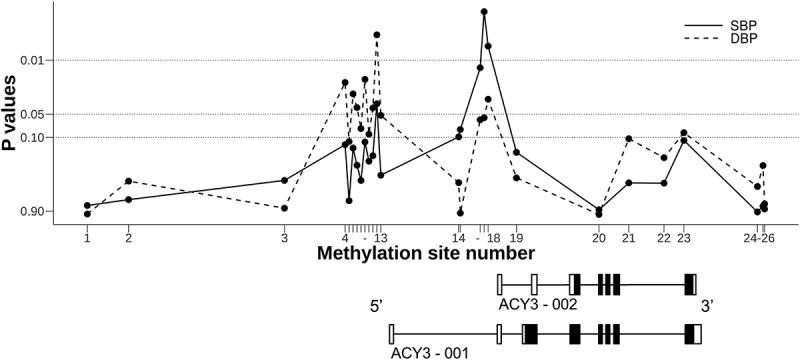
P-values for the associations of methylation sites across ACY3 with blood pressure response to bisoprolol in the GENRES Study. Black boxes on the transcript schemes represent coding exons, and white boxes non-coding exons. Lines between boxes depict introns. For methylation (CpG) site numbering (on the abscissa) and precise genomic positioning, see Table 3