
Figure 6.
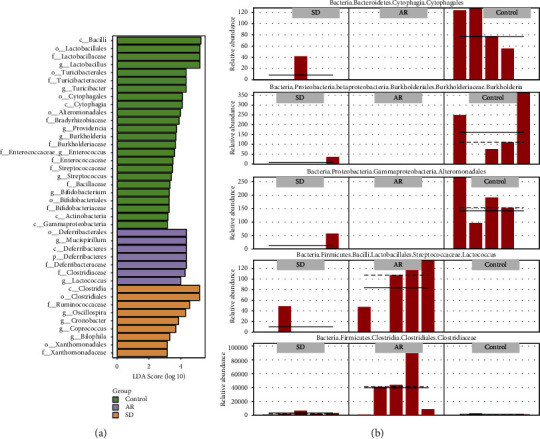
The species difference analysis of intestinal microflora in the AR mice with/without SD treated ((n) = 5). (a) The LDA effect size score of species with significant differences between the groups. The length is proportional to the significance of the difference, and the color indicates the group in which the species are with the highest abundance. (b) The relative abundance distribution of representative marker microorganisms in different groups. Solid and dashed lines indicate relative abundance mean and median values. SD: Saposhnikovia divaricata, and AR: allergic rhinitis.